Frequently Asked Questions
Here's a running list of frequently asked questions about Charty. If your question isn't covered here, don't hesitate to Get in touch.
Index
- General
- What is Charty?
- What is Shortcuts?
- I'm a total beginner, how do I use Charty?
- Are there other Shortcuts Utility Apps?
- How much does Charty cost?
- What kind of charts can I create with Charty?
- Shortcuts
- What actions does Charty add to Shortcuts?
- What's the simplest chart I can create with Charty?
- What kind of data should I pass to Charty's values parameters?
- Is there anywhere I can learn more about Charty's actions?
- Where can I find example shortcuts to see what I can do with Charty?
- Exporting
- Is it possible to export images of the charts?
- What are export profiles?
- How can I get to the export view from the app?
- How do I use the Export Chart As Image action?
- Shortcuts opens Charty when running the Copy Chart To Clipboard action. Is something wrong?
- Data sources
- What Data Sources can I use with Charty?
- Does Charty support data from HealthKit?
- Why "almost any data"? Is something missing from HealthKit Shortcuts support?
- What about APIs?
- Does Charty support CSV files?
- Customization
General questions
What is Charty?
Charty is an iOS app that allows you to create charts directly from Apple's Shortcuts app. It's part of a flourishing category of apps that's known as Shortcuts Utility Apps.
What is Shortcuts?
Shortcuts is the tool to create automation workflows on iOS and iPadOS.
Quoting Apple: Shortcuts includes over 300 built-in actions and works with many of your favorite apps including Contacts, Calendar, Maps, Music, Photos, Camera, Reminders, Safari, Health as well as any app that supports Siri Shortcuts..
I'm a total beginner, how do I use Charty?
You'll use Charty in the same way you'd create a chart or a graph on paper. On paper you would gather the information you want to use to make your chart; get some paper; draw some axes; plot your information; and finally share your creation.
In a shortcut using Charty it’s exactly the same:
- Grab your data from a file, the clipboard, or a utility like Data Jar, or just put some numbers together within your Shortcut;
- Create a chart using Charty’s New Chart action;
- Plot your information using the Add Series To Chart action;
- Ask Charty to put your new chart on the clipboard using Copy Chart To Clipboard Copy Chart To Clipboard is a Premium action. So, if you’re using the free version, you can see your chart in the app.
- Display the chart from within your shortcut, for example using Shortcuts’ Quick Look action;
- If you don’t want to keep your chart, you can throw it away using the Delete Chart action.
And that’s it!
Are there other Shortcuts Utility Apps?
There are 5 other apps in this category besides Charty.
How much does Charty cost?
Charty is free to download with iOS 14 Widgets support and 5 Shortcuts' actions: New Chart, Add Series To Chart, Style Chart, Delete Chart and Get Information From All Chart.
A one-time in-app purchase unlocks:
- 17 extra Shortcuts' actions: New Chart With Series, Add Series From CSV, Export Chart As Image, Copy Chart To Clipboard, Style Axis, Style Bar Series, Style Line Series, Style Pie/Donut Series, Style Scatter Series, Add Average, Add Moving Average, Apply Quick Style, Add Custom Theme, Group Data, Filter Data, Accumulate Values and Update Widgets
- Series styling and customisation (line width, stacked bars, markers size, series' colors, etc)
- Axis styling and label customisation (date time format, custom labels, etc)
- Custom themes
- Unlimited series per chart
- 31+ extra icons
This in-app purchase costs $4.99.
What kind of charts can I create with Charty?
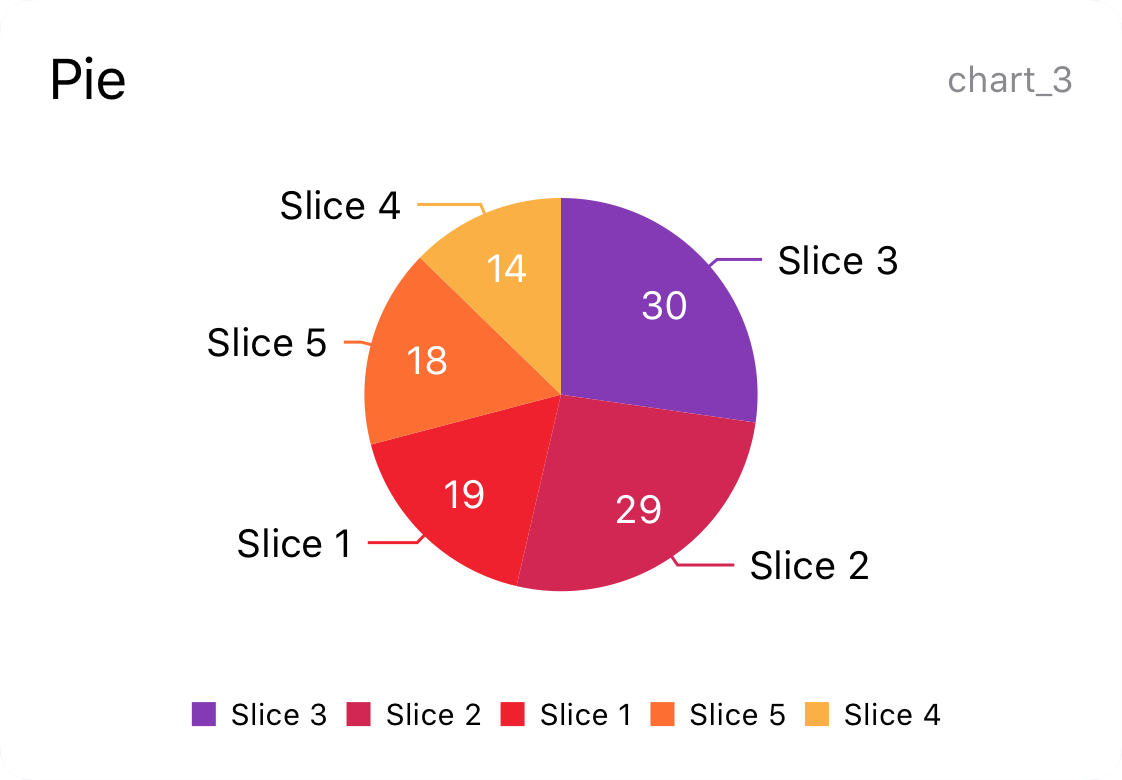
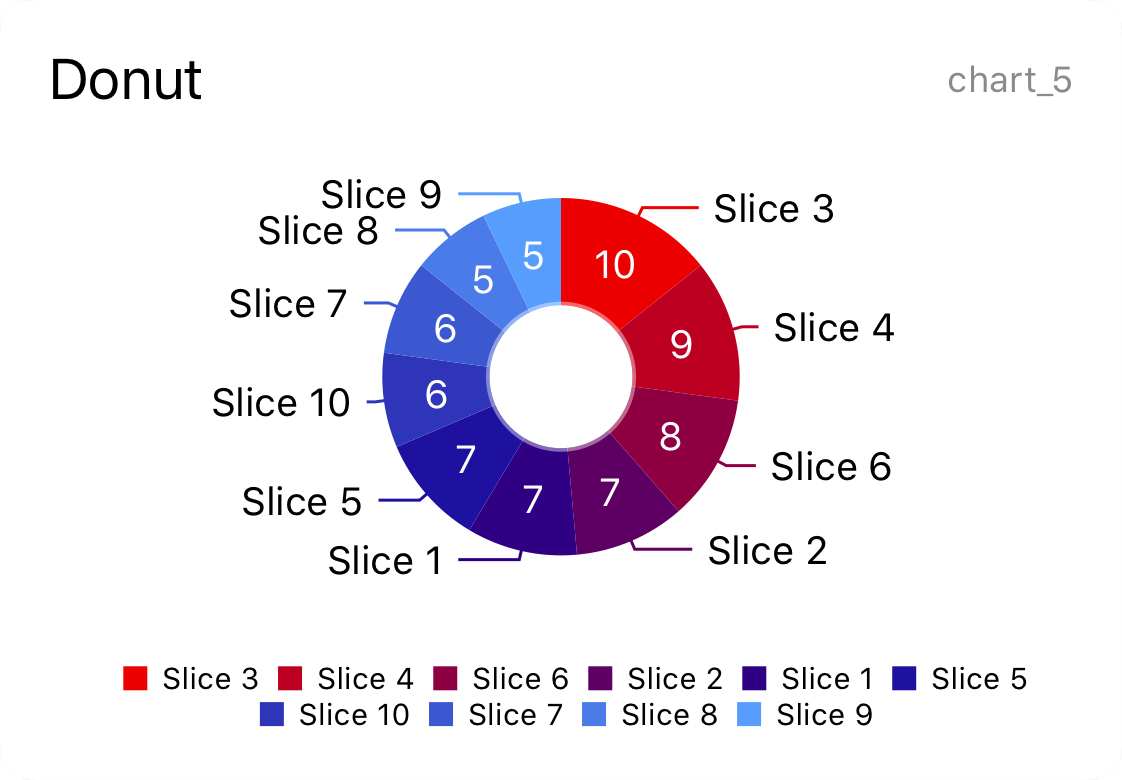
Using Charty, you can create 5 types of charts: Bar, Line, Scatter, Pie and Donut.
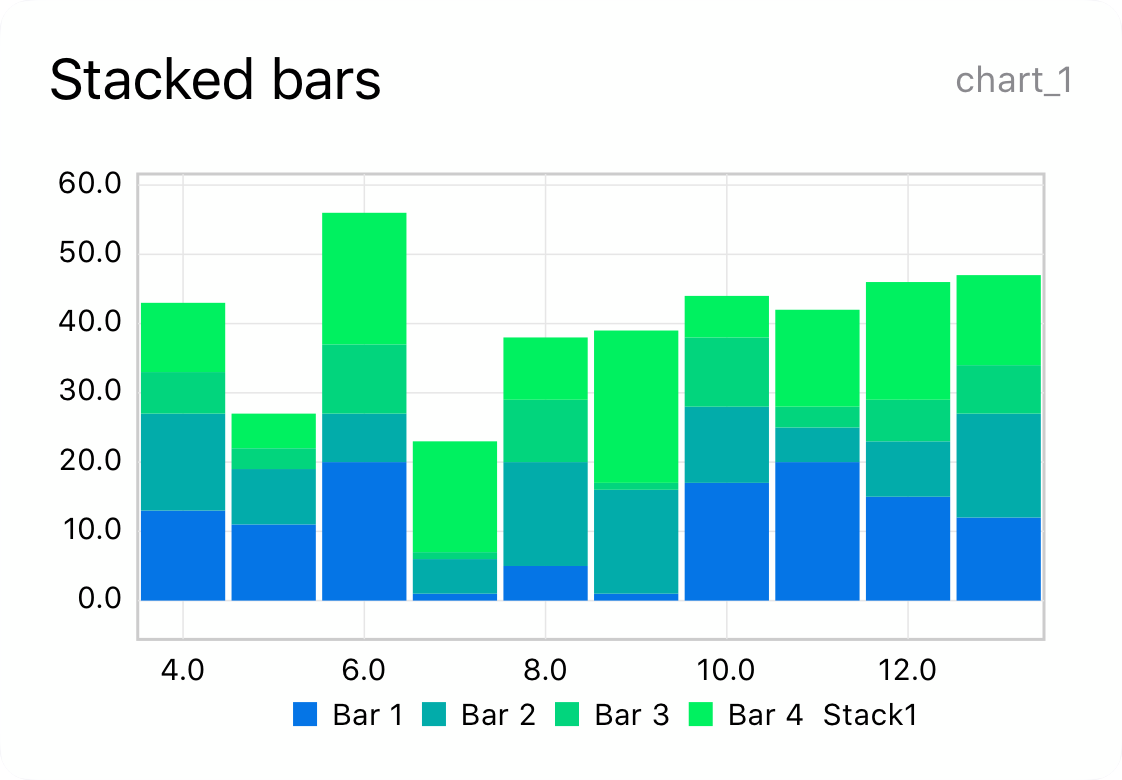
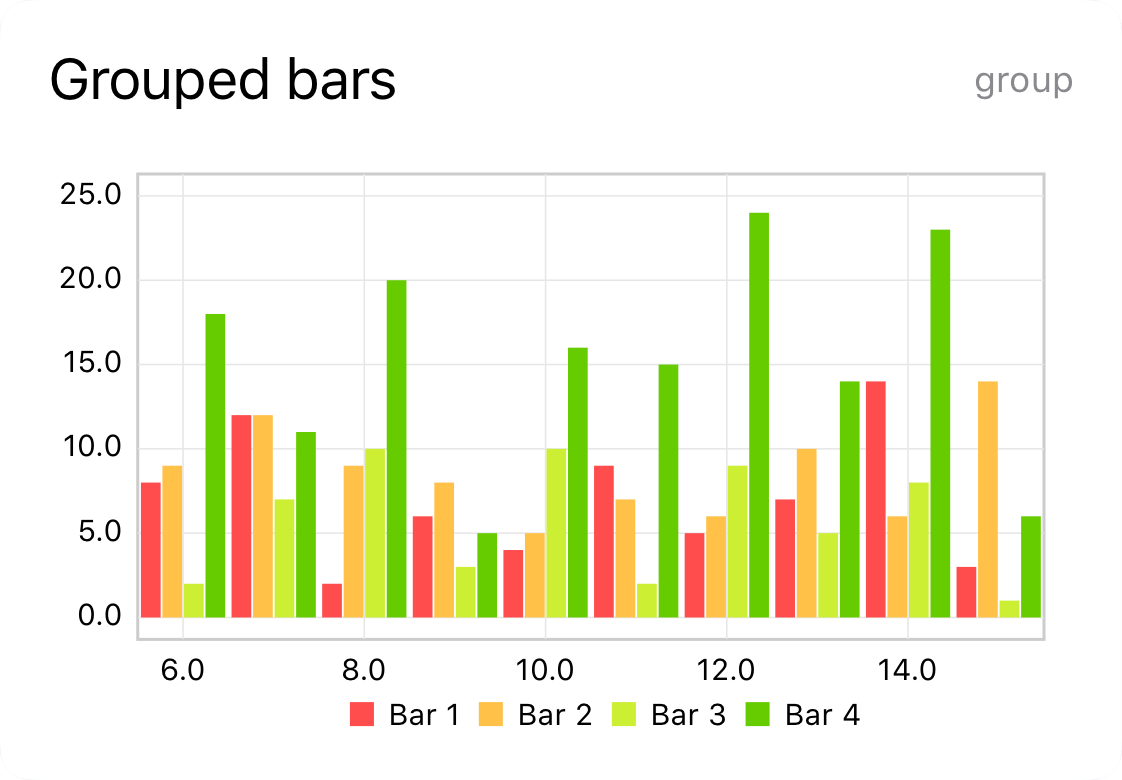
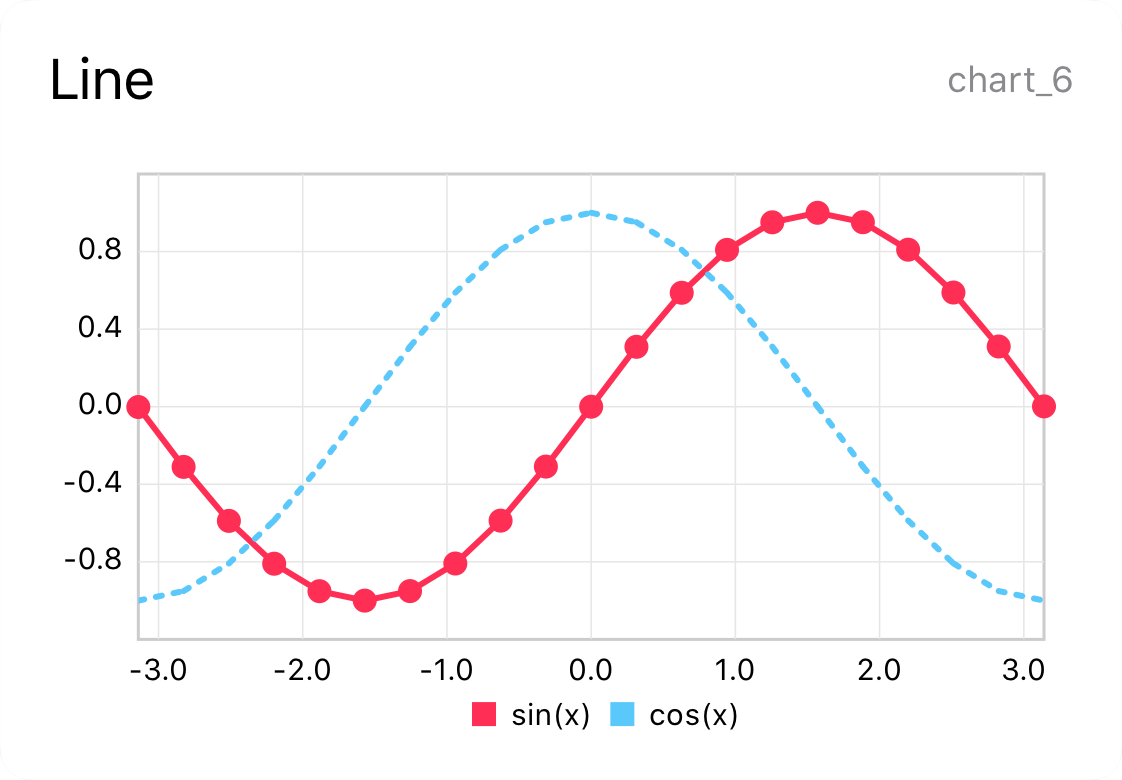
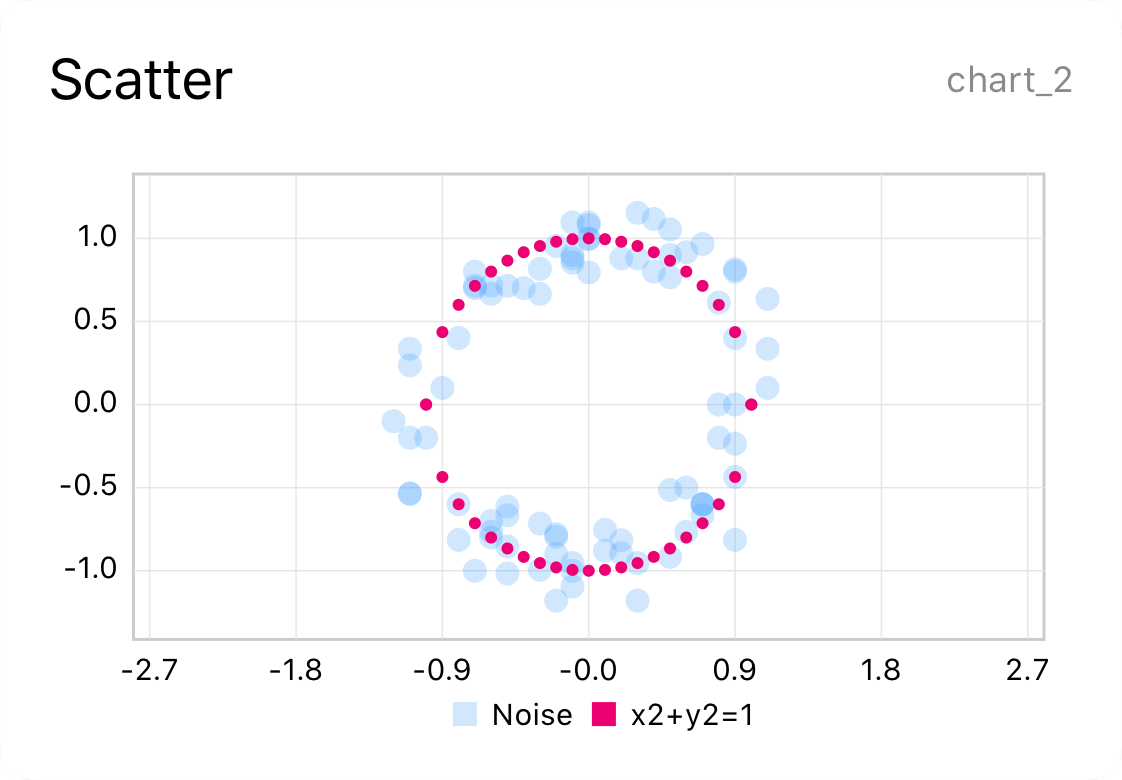
Shortcuts
What actions does Charty add to Shortcuts?
Charty adds 17 powerful new actions to Shortcuts:
| Action | Description | Free/Premium |
|---|---|---|
| New Chart | Creates a new chart with the given chart title | Free |
| Add Series To Chart | Adds a new series to a given chart | Free |
| Get Information From All Charts | Gets a dictionary of all charts, indexed by the charts' ids and containing all of the information available for each chart, except series points. | Free |
| Delete Chart | Deletes the chart with the given ID | Free |
| Style Chart | Modifies the attributes of a given chart | Free |
| New Chart With Series | Creates a new chart and adds a new series to it | Premium |
| Export Chart As Image | Exports the chart with the given ID as an image using the provided export profile directly in Shortcuts. | Premium |
| Copy Chart To Clipboard |
Exports the chart with the given ID as an image using the provided export profile, and puts the resulting image to the clipboard This action will be deprecated in the next version |
Premium |
| Add Series From CSV | Adds new series from a CSV file | Premium |
| Add Custom Theme | Adds the passed colors as a new theme | Premium |
| Style Axis | Use this action to style any of the parameters for a given axis | Premium |
| Style Bar Series | Modifies the attributes of a given bar series | Premium |
| Style Line Series | Modifies the attributes of a given line series | Premium |
| Style Pie/Donut Series | Modifies the attributes of a given pie or donut series | Premium |
| Style Scatter Series | Modifies the attributes of a given scatter series | Premium |
| Add Average | Adds a new series based on the average of other selected series | Premium |
| Add Moving Average | Adds a moving average series based on the selected series values | Premium |
| Apply Quick Style | Applies a quick style to the selected chart and series | Premium |
| Group Data | Groups the selected x and y lists based on a specific criteria | Premium |
| Filter Data | Filters the selected x and y lists based on values from a parameters list | Premium |
| Accumulate Values | Creates a new accumulated sum list based on an input list | Premium |
| Update Widgets | Updates the selected chart's widgets if any are found | Premium |
What's the simplest chart I can create with Charty?
Here's a link to download the simplest shortcut possible. It uses Charty's New Chart and Add Series To Chart actions to create a very simple bar chart.
What kind of data should I pass to Charty's values parameters?
If you have data stored as text with one value per line and no headers, you can pass the text directly as X or Y values to Charty. But you'll usually be using repeat loops (either Repeat or Repeat With Each) combined with the Add To Variable action to create lists of values.
The first part of this tutorial details how you can use a repeat loop to create a list.
Is there anywhere I can learn more about Charty's actions?
Inside the app, tap on the gear icon on the top right to go to the Settings view. In there, tap on Actions descriptions and you'll see a list of Charty's 11 actions. Tapping any of them will show you a detailed view of each actions parameters, outputs and miscellaneous information.
Where can I find example shortcuts to see what I can do with Charty?
You can see 42 examples in the Examples' gallery inside the app just by tapping on the Examples button in the top left of the main view. You can also head to the Examples page here in the website to see a running list of more shortcuts!
Exporting
Is it possible to export images of the charts?
Definitely! You can either do it using the Export Chart As Image action on your shortcut or you can do it directly on the app. Both of these ways use the export profiles to configure how the chart will be exported.
What are export profiles?
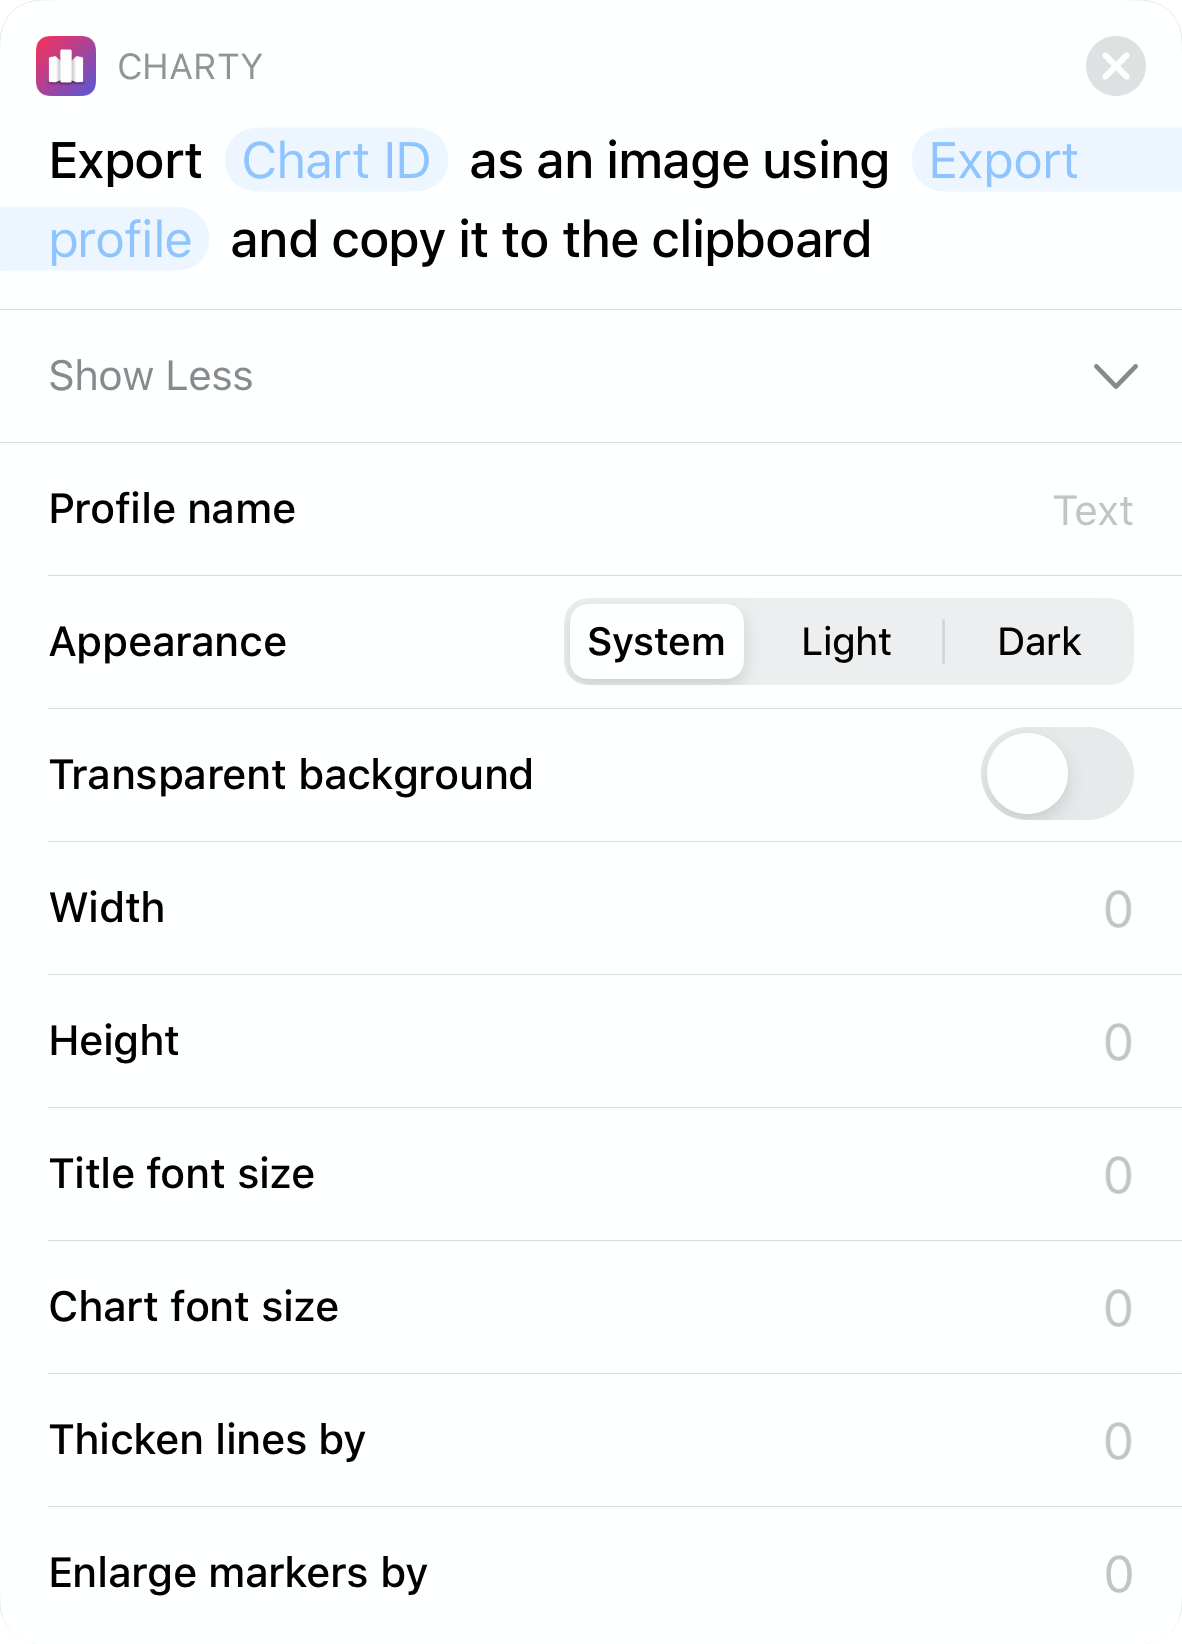
Export profiles are bundles of settings that define how a chart should be exported, so you'll only have configure them once, and then export everything. These are the settings controlled by export profiles:
- Appearance: defines wether your chart should use Light or Dark mode colors, or if you'd like to follow what's defined in the system at the moment;
- Transparent background: wether you'd like to have a transparent background behind your chart;
- Width and Height: the dimensions of the exported image in pixels;
- Title font size: the font size (in points) of your chart title;
- Chart font size: the font size (in points) to use for the chart's elements;
- Thicken lines by: when images get bigger, lines that looked good in the app might need some thickening. Use this setting to make all the lines in the chart thicker;
- Enlarge markers by: the same thing applies to markers. Use this setting to make all the markers in the chart larger.
How can I get to the export view from the app?
There's two ways:
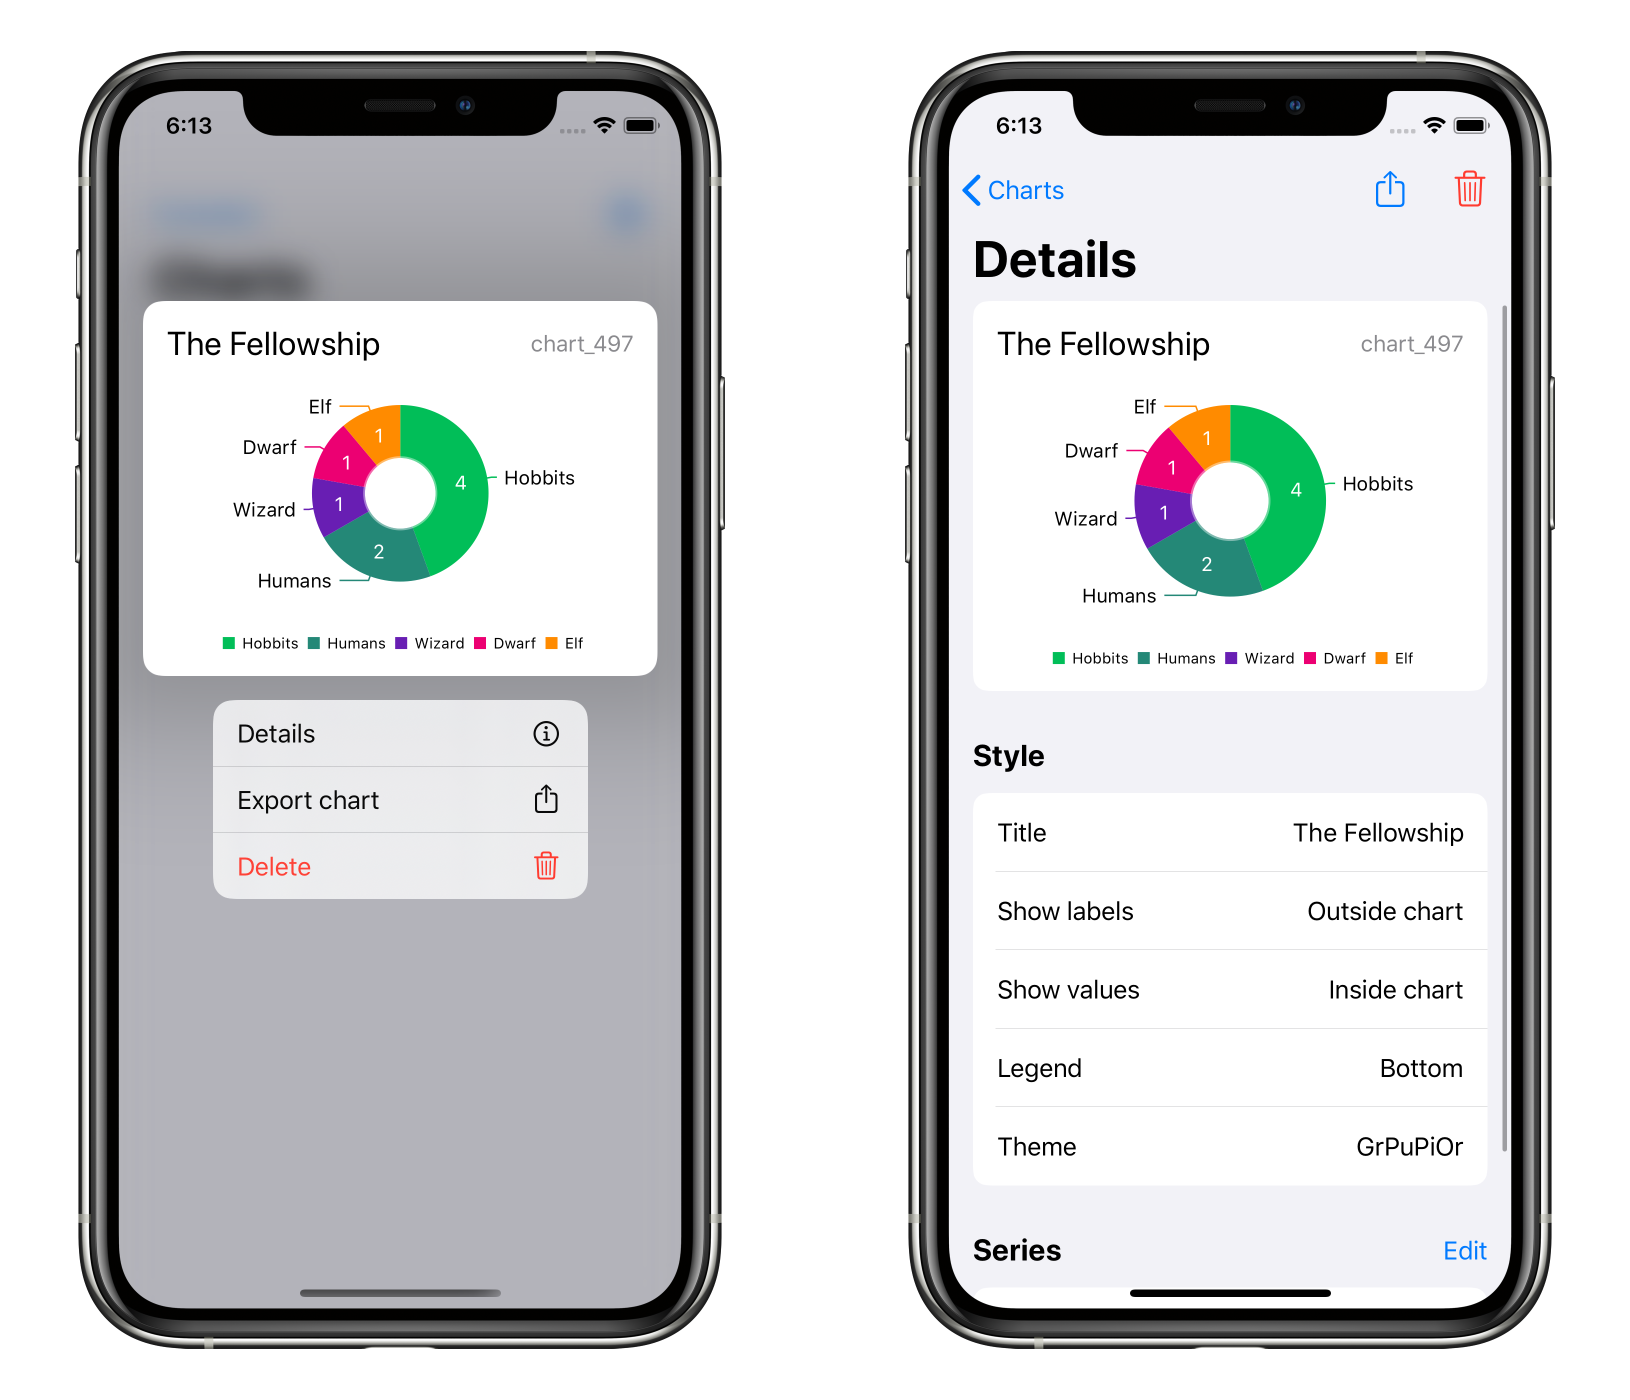
- Long press on any chart in the main view to display the context menu and then tap on Export chart;
- Select any of your charts from the main view, then tap on the share button on the top right corner.
How do I use the Export Chart As Image action?
When you add the Export Chart As Image action, you'll need to provide the ID of the chart you're trying to export and an export profile. If you choose the default profile or any other profile you've created, you're done. There's no need to fiddle with the other parameters as Charty will get all the required information from the profiles.
But if you choose the Create new export profile option, you should modify at least one of the other parameters, otherwise, it'll be exported with the default values that are identical to the Default export profile.
Shortcuts opens Charty when running the Copy Chart To Clipboard action. Is something wrong?
You shouldn't be using the Copy Chart To Clipboard action anymore! Since Charty 1.3, the new Export Chart As Image has been introduced making it possible to avoid exactly this sort of problem!
Data sources
What Data Sources can I use with Charty?
Virtually, any data source that provides Shortcuts support can be used with Charty.
For example, if you store data in text notes inside the Notes app, you can extract them using the Find Notes action. You can then process it with Shortcuts and plot it with Charty.
Does Charty support data from HealthKit?
Of course! It's not widely known, but HealthKit has great Shortcuts support. You can use the Find Health Samples action to get almost any data from HealthKit. You can then process it with Shortcuts and plot it with Charty.
Why "almost any data"? Is something missing from HealthKit Shortcuts support?
Unfortunately, yes. You can't extract Workouts and Activity data with Health's default actions. But, if you buy Toolbox Pro premium package, you'll get the premium actions Get Activity and Get Workouts that solve this problem.
What about APIs?
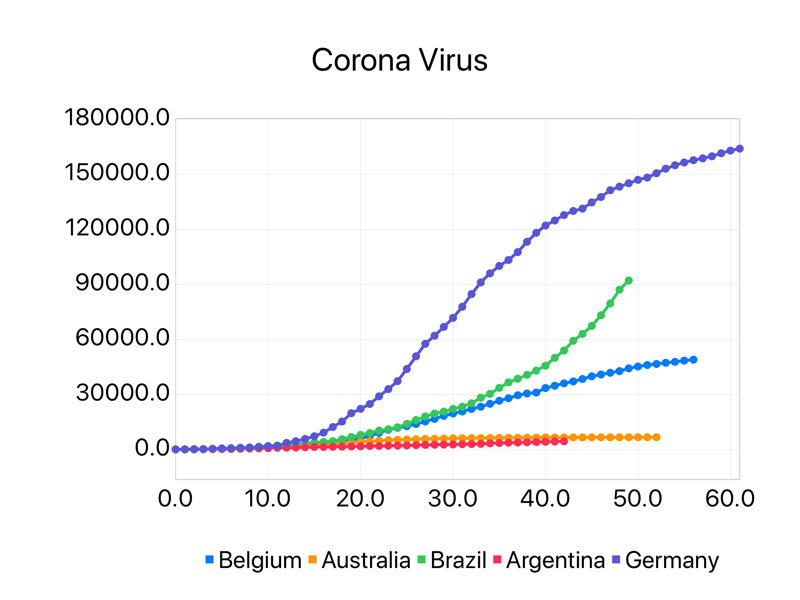
API data can also be extracted and plotted with Charty. You can use the Get Contents of URL action to make a request to the API. You can then process it with Shortcuts and plot it with Charty.
Here's an example that queries a COVID-19 tracking API and creates charts such as the one below using Charty.
Does Charty support CSV files?
Charty's Premium version has great support for CSV files through the Add Series From CSV action. With it, you can select which of the CSV file's columns should be used as x values and which should be used as y values. If you want more information about this action, you can check the tutorial How to plot data from a CSV file.
Customization
Can I change the chart theme from Shortcuts?
Yes! Just use the free action Style Chart and select which theme you'd like. If you find yourself always going for the same theme, you can modify the default theme with which your charts are created from the Default values view in Charty's Settings.
Can I add custom color themes to Charty?
Yes, and it can be done in one of three ways: using the Add Custom Theme action, importing a file with your color list or using Charty's url-scheme. If you want to know more about this, this post describes everything in detailm, but if you only want a giant list of new themes, head on to Charty's theme section!
Can I use a custom palette without adding a theme?
Yes. If you don't want to add a custom theme, you can use a text action to store your custom theme colors and then use one of the Style Series actions to change the color of the series accordingly.
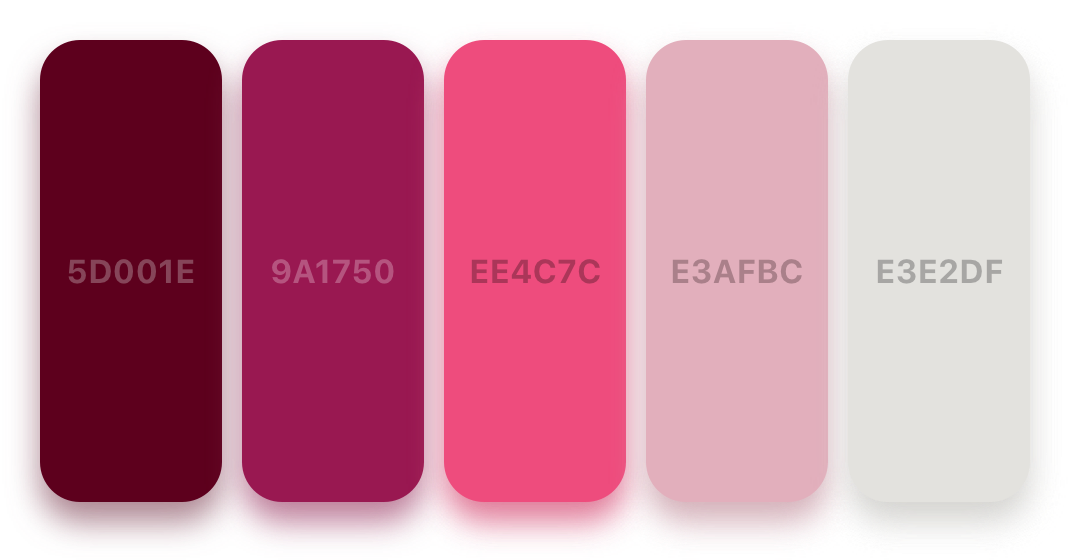
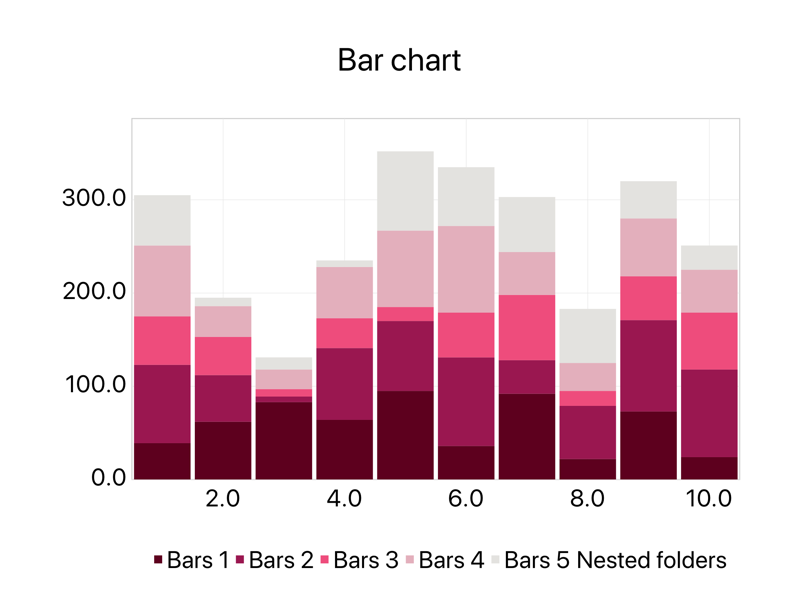
You can download this shortcut example that uses the above custom palette to create the following chart.
Can I add custom labels to an axis?
Using Charty's premium action Style Axis you can modify the value formatter for all axes. So you can set it to a custom formatter, passing a list of labels and their corresponding custom labels. You can check the tutorial How to add custom labels to an axis for more information about this action.