How to plot data from a CSV file
CSV stands for Comma Separated Values, and they are a great and simple solution to store data in table format using plain text files. This tutorial will look into how we can get data from a CSV file and used it to create charts using Charty.
Using CSV files in Shortcuts
There are two main ways to use that CSV file with Shortcuts:
- Getting it locally with the Get File action
- Getting it online with the Get Contents of URL action
The Get File action
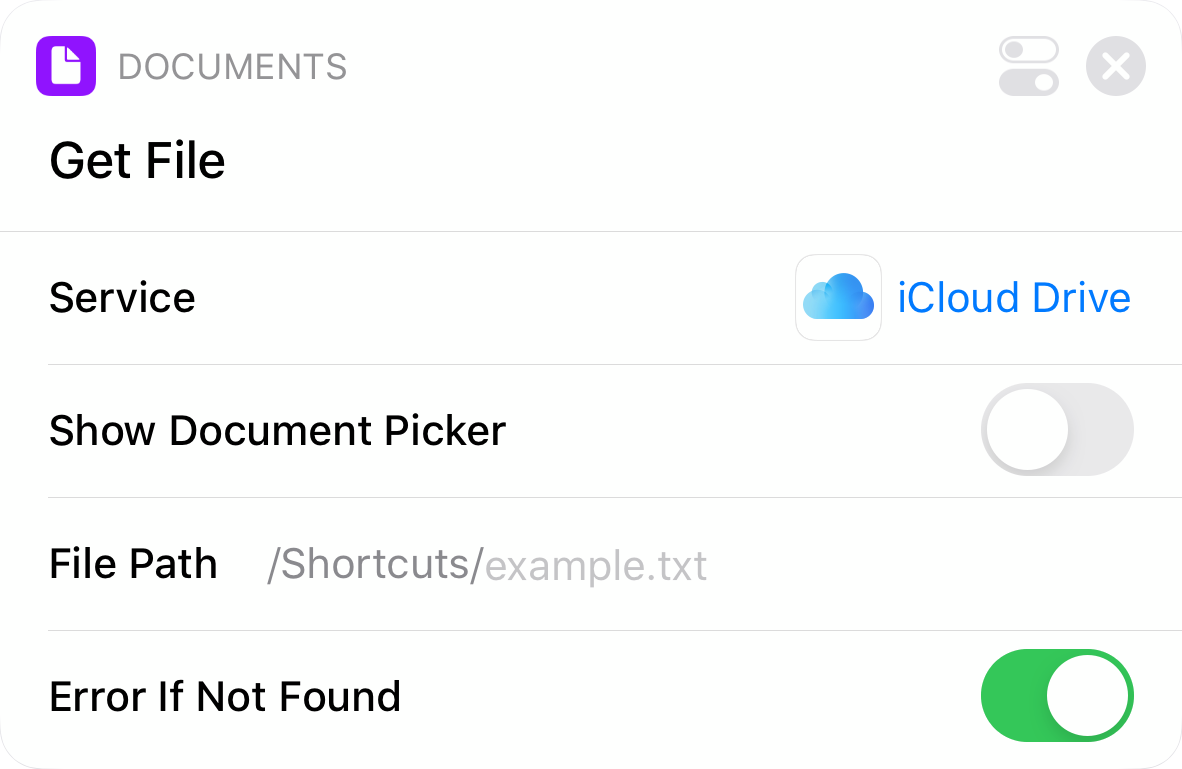
This action has only 4 parameters:
- Service: defines the cloud service Shortcuts should use to get the file. I defaults to iCloud Drive, but could also be Dropbox;
- Show Document Picker: If it's on, every time the shortcut run, it'll prompt you for a file. If it's off, the next parameter is enabled;
- File Path: this a standard system path to the file we're trying to access. Notice that, when iCloud Drive has been selected as the service, due to iOS sandboxing restrictions, Shortcuts can only access files inside its iCloud Drive Folder;
- Error If Not Found: if on, will display an error if the file can't be found and will stop the shortcut.

The Get Contents of URL action
This action has 1 main parameter:
- URL: defines where in the web your CSV file is hosted. In our example, we're showing a CSV hosted in Charty's servers to be used with its examples.
The Get File action

This action has only 4 parameters:
- Service: defines the cloud service Shortcuts should use to get the file. I defaults to iCloud Drive, but could also be Dropbox.
- Show Document Picker: If it's on, every time the shortcut run, it'll prompt you for a file. If it's off, the next parameter is enabled.
- File Path: this a standard system path to the file we're trying to access. Notice that, when iCloud Drive has been selected as the service, due to iOS sandboxing restrictions, Shortcuts can only access files inside its iCloud Drive Folder.
- Error If Not Found: if on, will display an error if the file can't be found and will stop the shortcut.
The Get Contents of URL action

This action has 1 main parameter:
- URL: defines where in the web your CSV file is hosted. In our example, we're showing a CSV hosted in Charty's servers to be used with its examples.
Charty's Add Series From CSV action
In order to add data from a CSV file to a chart, Charty provides the handy Add Series From CSV action.
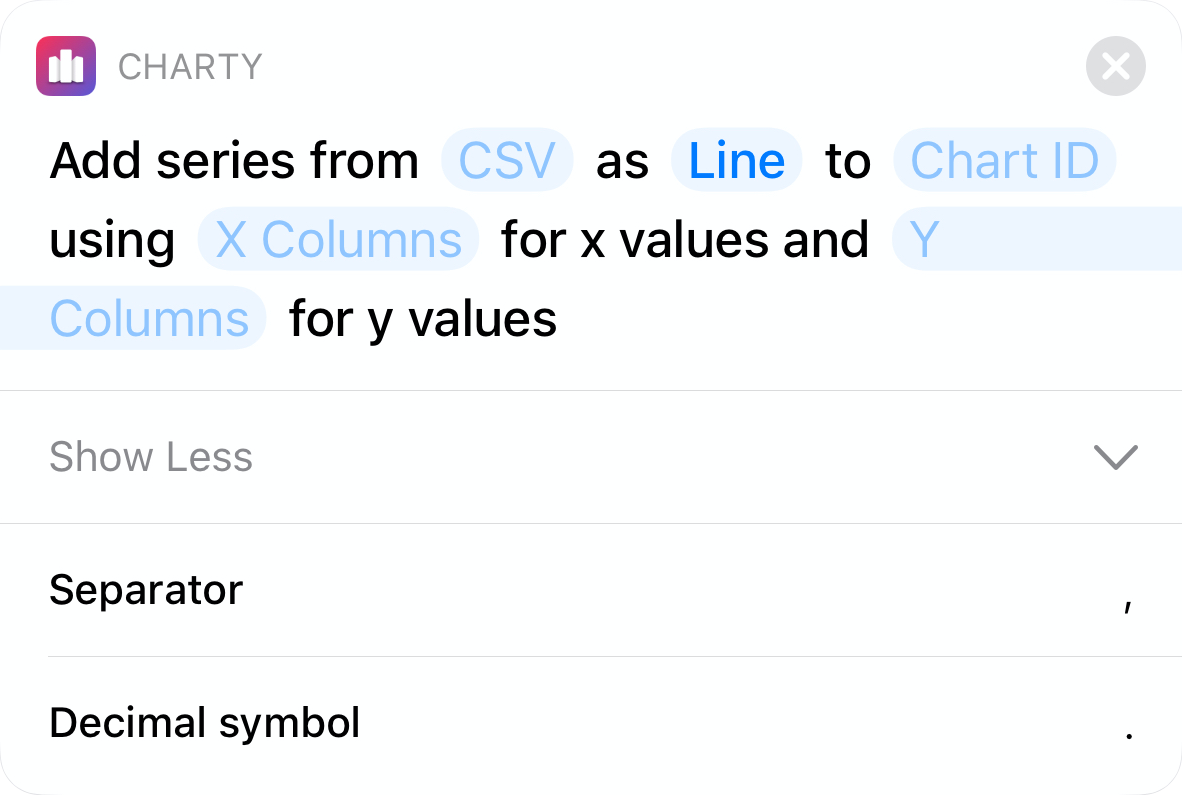
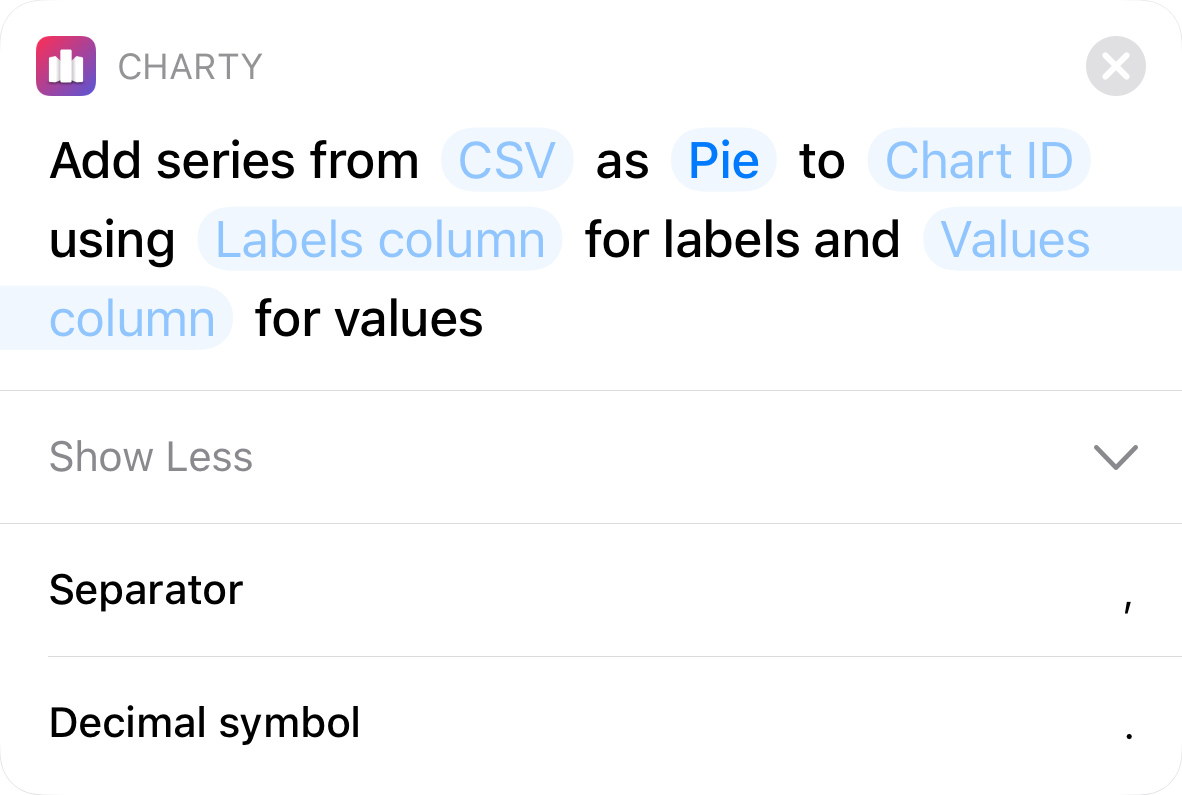
- CSV: this parameter will receive a CSV file opened in Shortcuts with one of the two actions cited above;
- Chart ID: the ID of the chart into which the series should be added;
- Series type: the type of series that'll be added from this CSV file. The options are: Bar, Line, Scatter, Pie and Donut;
- X Columns: a list of column names to use as x values for the series. As this is a list, you can add extra values by tapping the plus (+) sign that appears after you insert the first value.
- If X Columns is left empty, the index of each row will be used as the x values;
- If X Columns only contains one value, the same column will be used as the x values for all series.
- Y Columns: a list of column names to use as y values for the series. You can also add extra values by tapping the plus (+) sign that appears after you insert the first value;
- Labels column: the name of the column that holds the labels for each slice of your pie or donut;
- Values column: the name of the column that holds the values for each slice of your pie or donut;
- Separator: Defines the CSV column separator.Default value: , (comma);
- Decimal symbol: Defines the floating point separator.\nDefault value: . (dot);
When Bar, Line or Scatter are selected as the series type, you'll see the next two parameters
When Pie or Donut are selected as the series type, you'll see the next two text parameters
- CSV: this parameter will receive a CSV file opened in Shortcuts with one of the two actions cited above;
- Chart ID: the ID of the chart into which the series should be added;
- Series type: the type of series that'll be added from this CSV file. The options are: Bar, Line, Scatter, Pie and Donut;
- X Columns: a list of column names to use as x values for the series. As this is a list, you can add extra values by tapping the plus (+) sign that appears after you insert the first value.
- If X Columns is left empty, the index of each row will be used as the x values;
- If X Columns only contains one value, the same column will be used as the x values for all series.
- Y Columns: a list of column names to use as y values for the series. You can also add extra values by tapping the plus (+) sign that appears after you insert the first value;
- Labels column: the name of the column that holds the labels for each slice of your pie or donut;
- Values column: the name of the column that holds the values for each slice of your pie or donut;
- Separator: Defines the CSV column separator. Default value: , (comma);
- Decimal symbol: Defines the floating point separator. Default value: . (dot);
When Bar, Line or Scatter are selected as the series type, you'll see the next two parameters
When Pie or Donut are selected as the series type, you'll see the next two text parameters
Real World Example
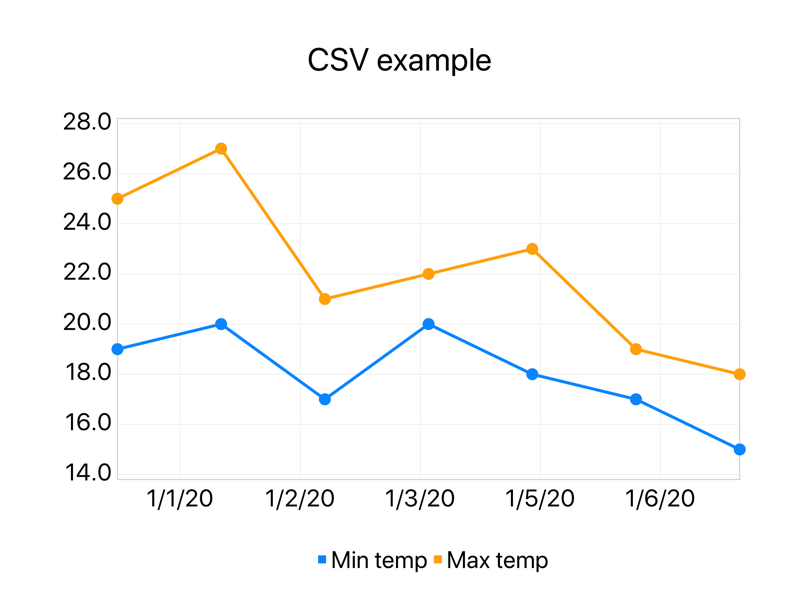
Let's suppose that we'd like to plot a CSV file like the one below.
| Date | Min temp | Max temp | % rain |
|---|---|---|---|
| 01/01/20 | 19 | 25 | 50 |
| 01/02/20 | 20 | 27 | 82 |
| 01/03/20 | 17 | 21 | 80 |
| 01/04/20 | 20 | 22 | 100 |
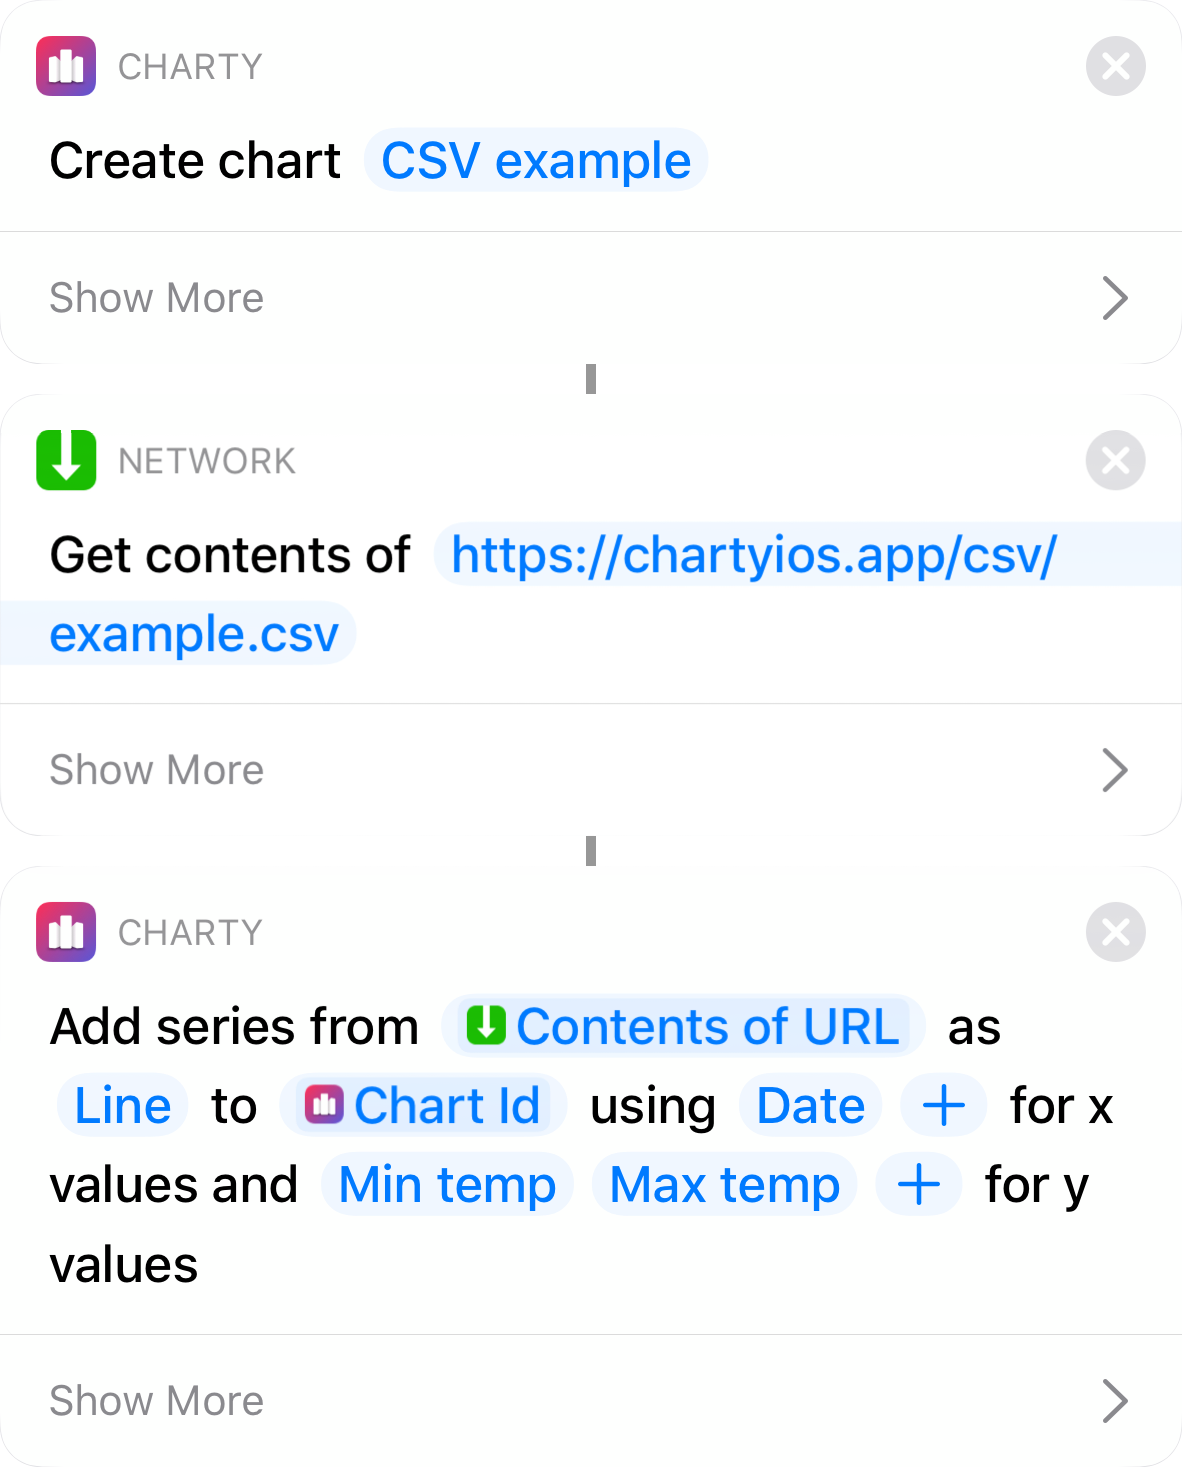
Here's what the shortcut to plot the minimum and maximum temperatures from this CSV file would look like:
Create Chart
This action simply creates a new Chart with the title "CSV example" and assigns it an automatic ID. This ID is the output of this action, so we can use it in Add Series From CSV action.
Get Contents of URL
As we saw, this action downloads the contents of CSV file hosted on Charty's servers.
Add Series From CSV
And here is where the magic happens 🎩!
We set the contents of the URL as the CSV parameter, and use the magic variable Chart Id obtained from the Create Chart to define the chart that'll receive these series.
Then, we define that the Date column will hold the X Values for both series. And the Y values will be obtained from two different columns: Min temp and Max temp.
And that's it, as this CSV file uses the default column and floating point separator (, and . respectively), there's nothing left to setup.
And here is the resulting chart.
