Charty gives you 26 powerful actions for Apple's Shortcuts app, letting you visualize any data beautifully.
★★★★★
"Super fun. Widgets are ridiculously useful. Really, really fun app."
Joel D. Arnold
★★★★★
"Charty is AWESOME! Powerful. Quick to Learn & Easy to Use!"
Plane Wryter
★★★★★
"Shut up and take my money. This is hands down the best app on the App Store."
Jordan Skole
★★★★★
"Changed my iPhone forever. I have found so many shortcuts that use Charty, Omnifocus and Health that my home screens are so much more useful."
Maria L.
★★★★★
"Great App, very powerful extension to shortcuts. Awesome what you can do with this app."
Yk-cgy
★★★★★
"AMAZING! I loe being able to create widgets to see things like my steps on my phone home screen or lock screen. This does this."
EMAP83
★★★★★
"There’s nothing else like it. There’s a learning curve to be sure, but the dev has done a remarkable job of helping people to get started."
John Catalano
★★★★★
"The greatest Siri Shortcut app. I love this one. Help me maintain my calorie intake throughout the day."
Super Believer
★★★★★
"What a great utility. I use it to graph website analytics with an Apple Shortcut and using Plausible APIs. It great."
Numeric Citizen
★★★★★
"Really useful. Happy to have this app in my arsenal to keep track of stuff!"
Rodrigo Escobar
★★★★★
"Charty is AWESOME! Powerful. Quick to Learn & Easy to Use! [...] A BIG THANK YOU to Rodrigo for creating and distributing this remarkably useful tool!"
Plane Wryter
★★★★★
"A must have for every Shortcuts user. This is an amazing app that gives Shortcuts users new powerful actions to create and manipulate charts."
Inakira
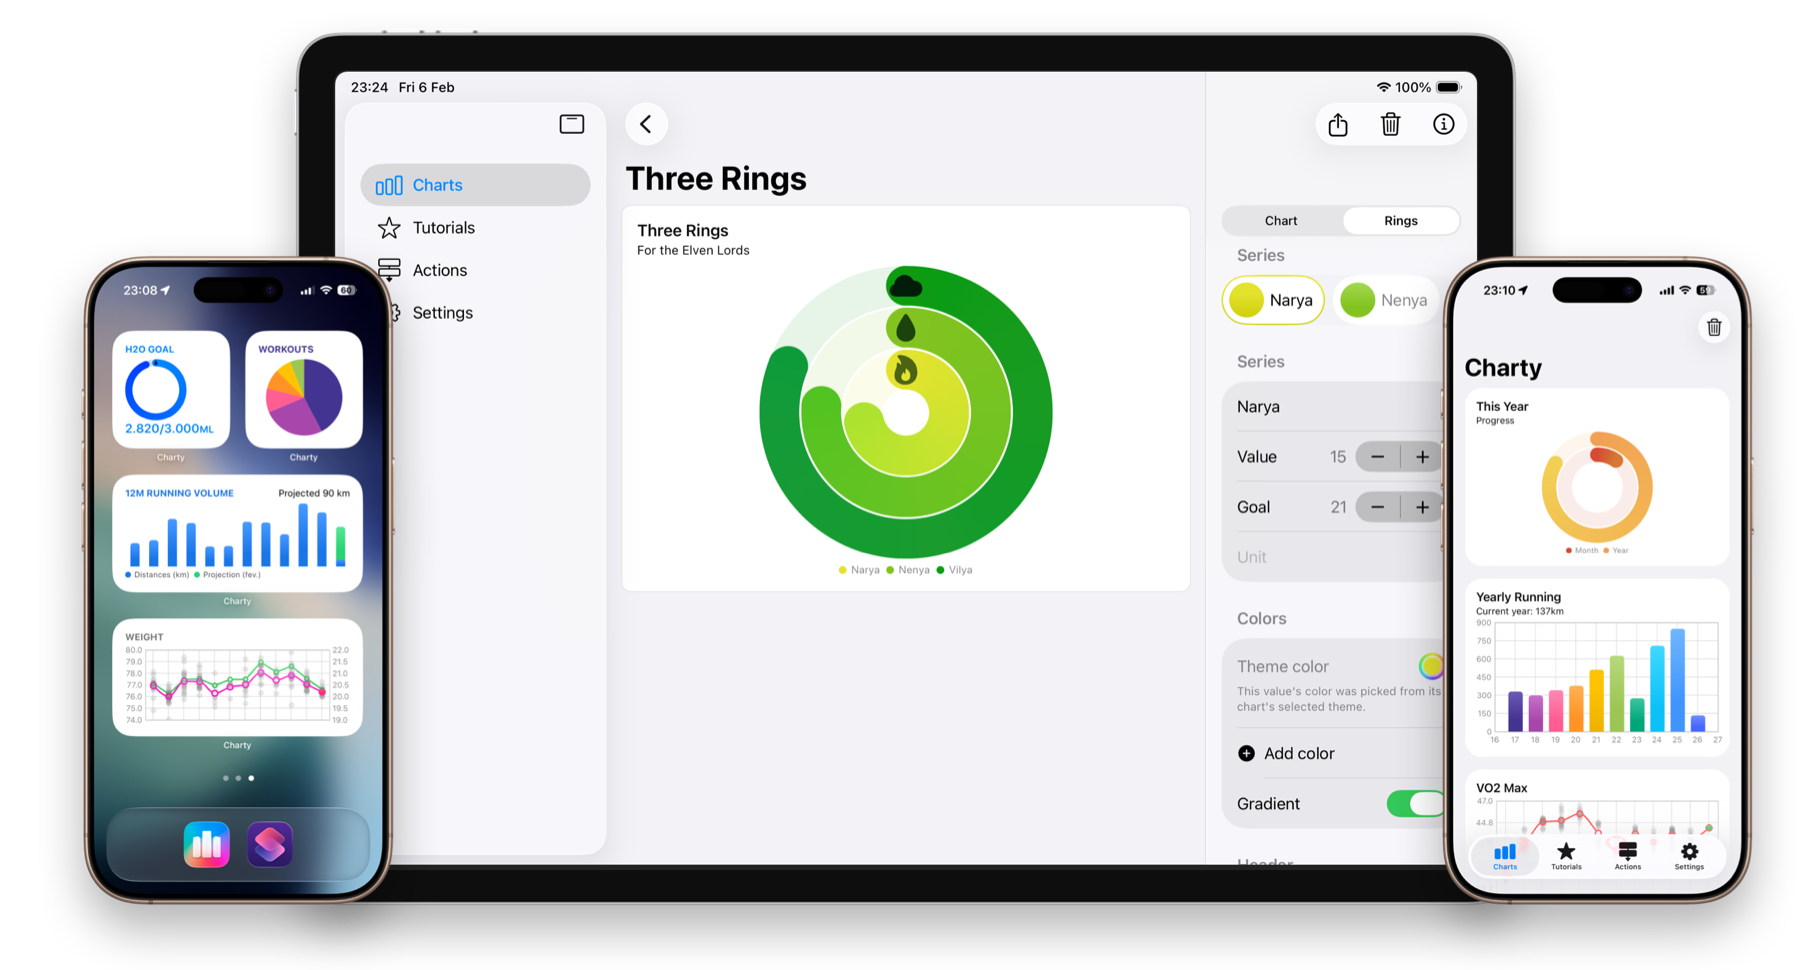
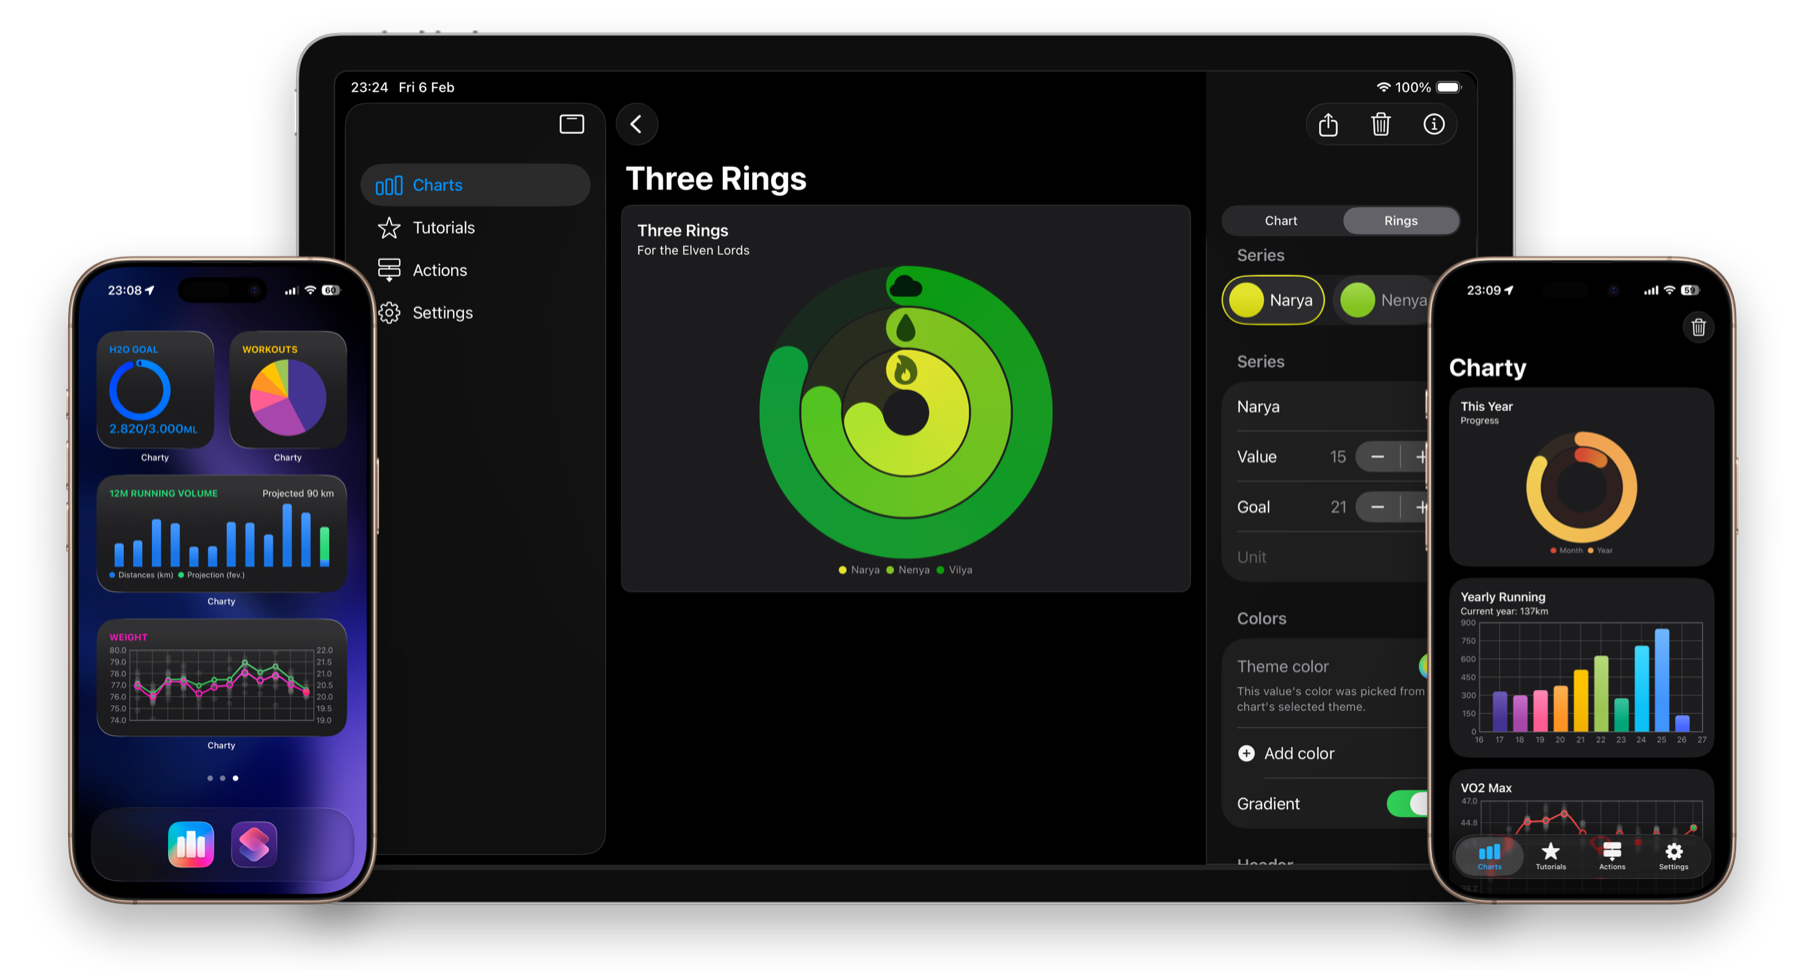
Visualize your data
Numeric series: Area, bar, line, and scatter charts let you plot numeric data over time, compare categories, or spot trends at a glance. Perfect for tracking workouts, finances, screen time, or any data you collect through Shortcuts.
Circular series: Pie and donut charts are ideal for showing proportions and composition. Use them to break down budgets, survey results, or any data where the parts make up a whole.
Ring series: Ring charts display progress toward a goal, similar to Apple's Activity rings. Great for tracking daily targets, completion rates, or any metric with a clear maximum value.
4 Widget styles in multiple sizes
Four widget types for your Home Screen — and they refresh when your data changes
Built for Shortcuts
Charty provides 26 actions built with AppIntents, giving you full control over chart creation, styling, and data management directly from Apple's Shortcuts app. Create a chart, add series, apply themes, export images — all without opening Charty.
Privacy First
Your data stays on your device and syncs through iCloud. Charty never collects, shares, or sells your information.
iCloud Sync
Your charts, series, and settings sync seamlessly across all your devices through iCloud.
No Ads
Charty is supported entirely by subscriptions. No ads, no trackers, no data harvesting — just a clean charting tool.
Simple pricing
Start free with 5 essential actions — unlock everything with a subscription
Monthly
$0.99/month
Full access to all 26 actions, every series type, themes, gradients, and widgets.
Yearly
$9.99/year
Everything Charty has to offer, for less than the price of ten months.
Save 16%
Bought Charty Premium before?
You keep full access to everything in Charty 2.0 — no subscription needed. Read more in the FAQ.