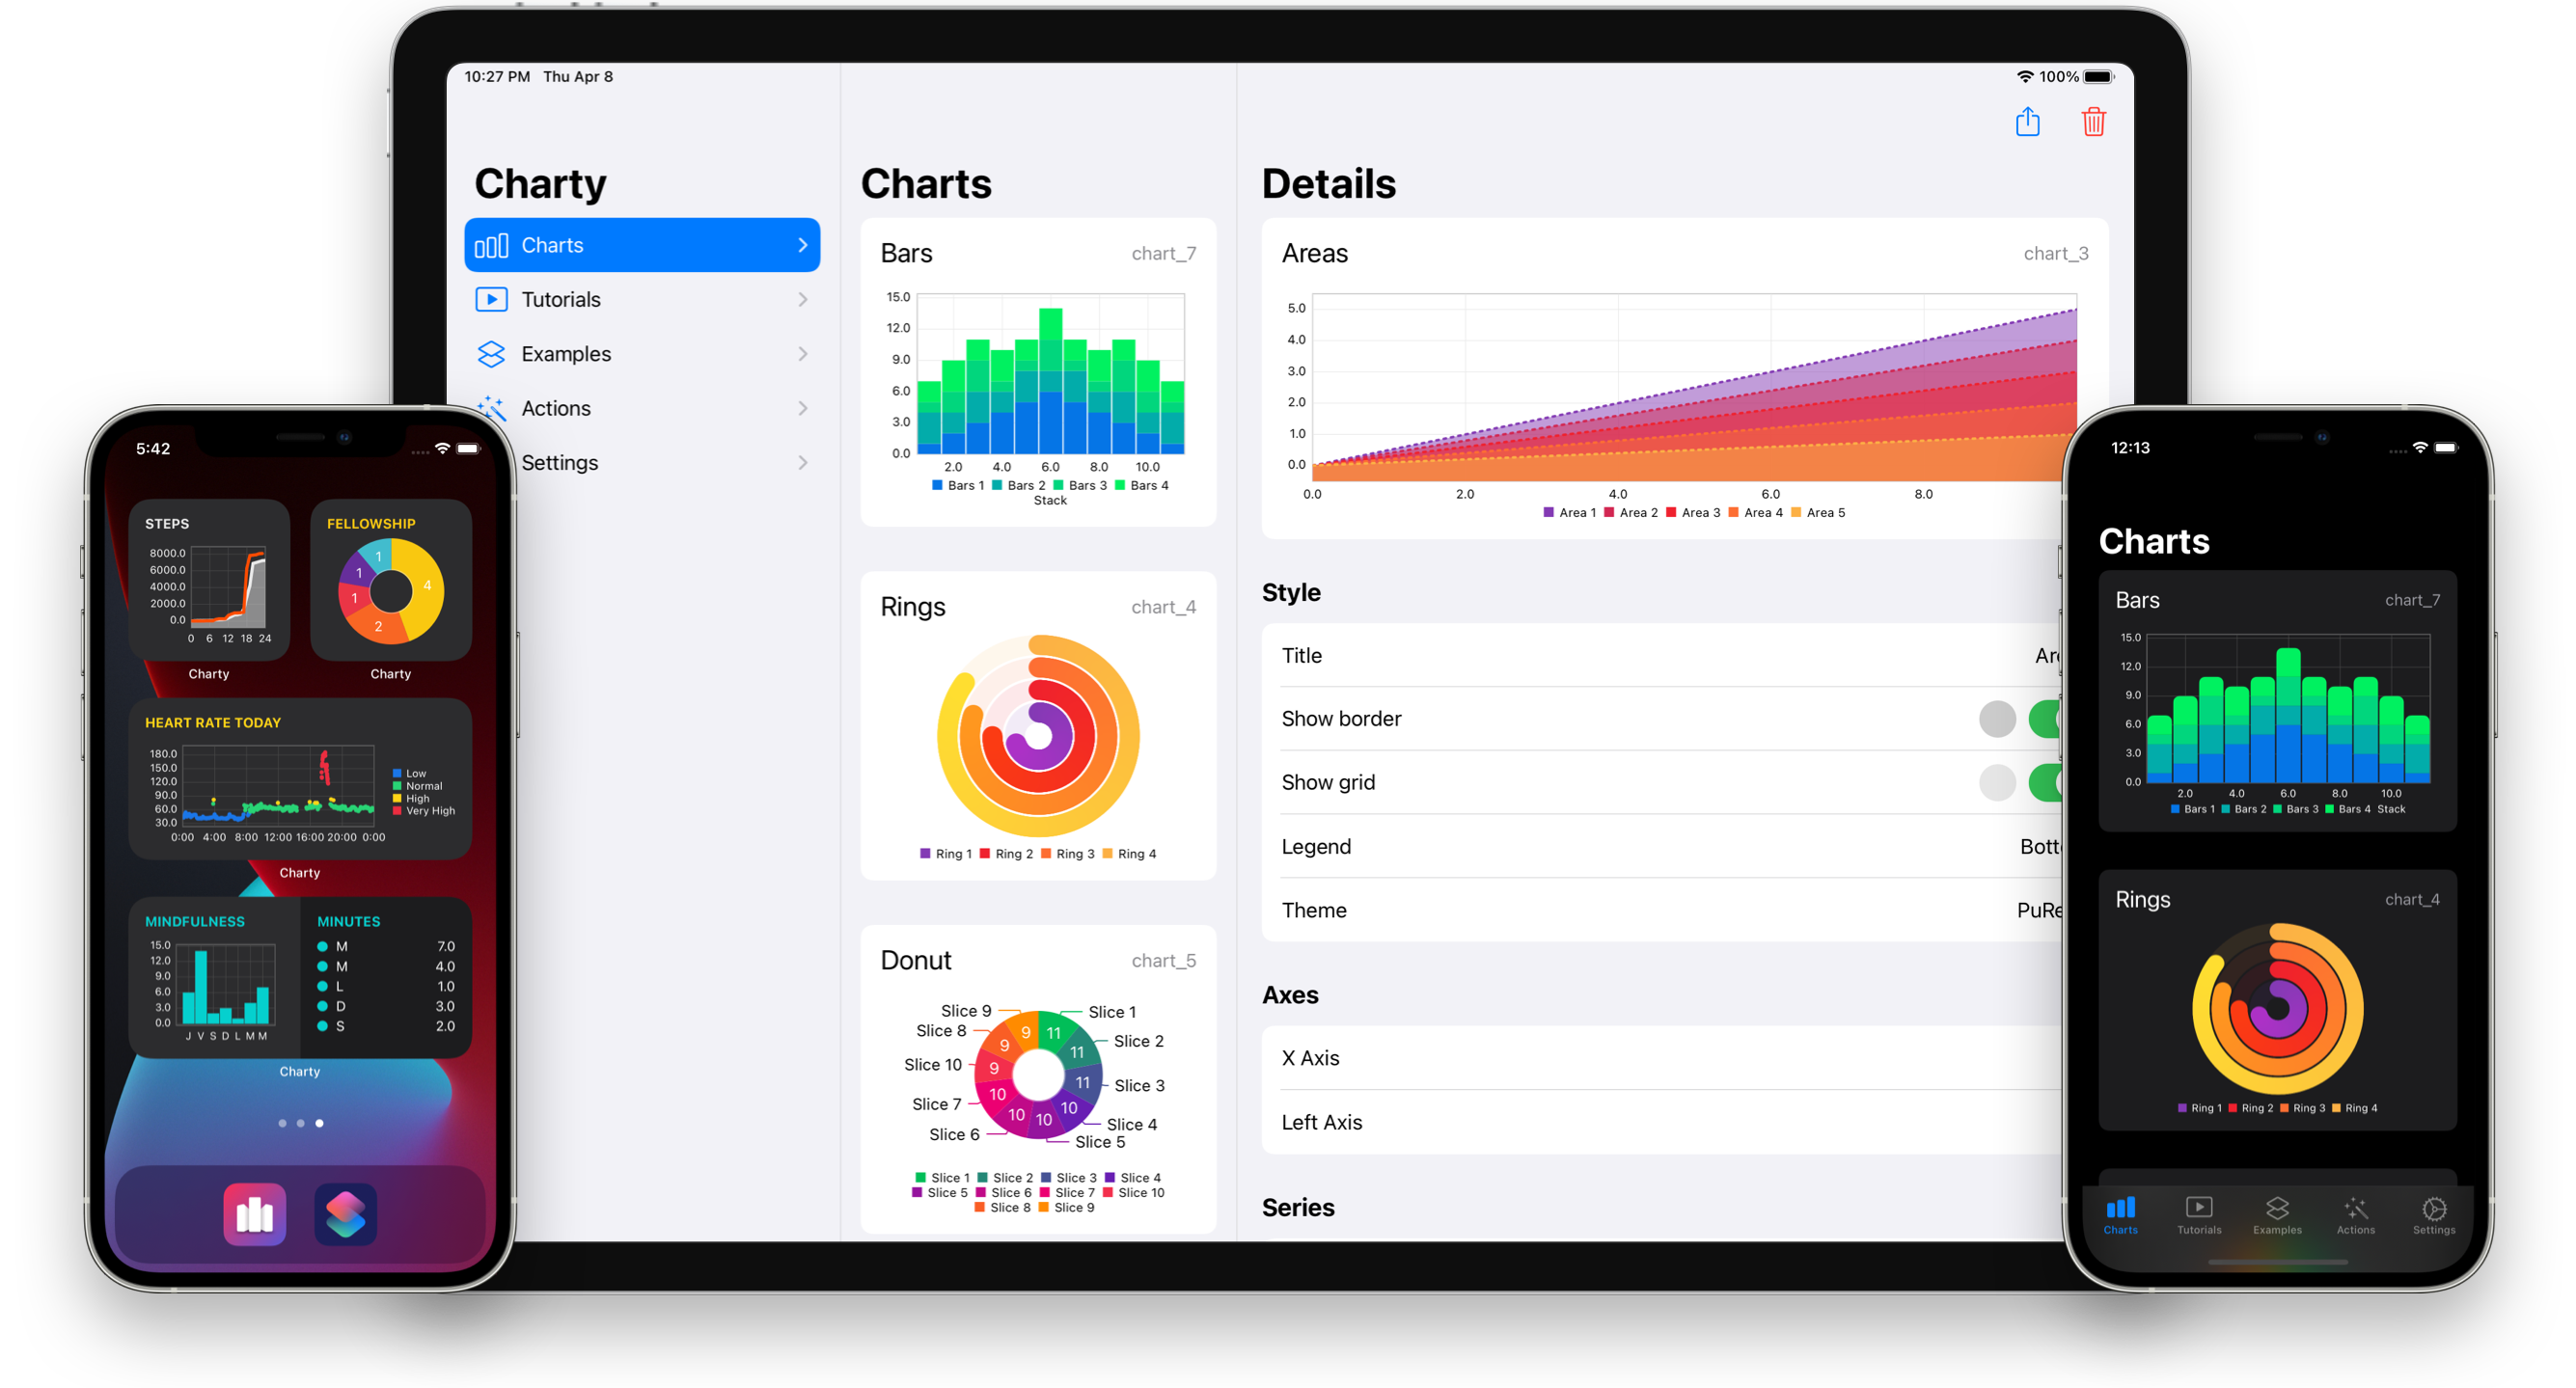
Each of the examples displayed below are available in the Example's gallery inside the app.
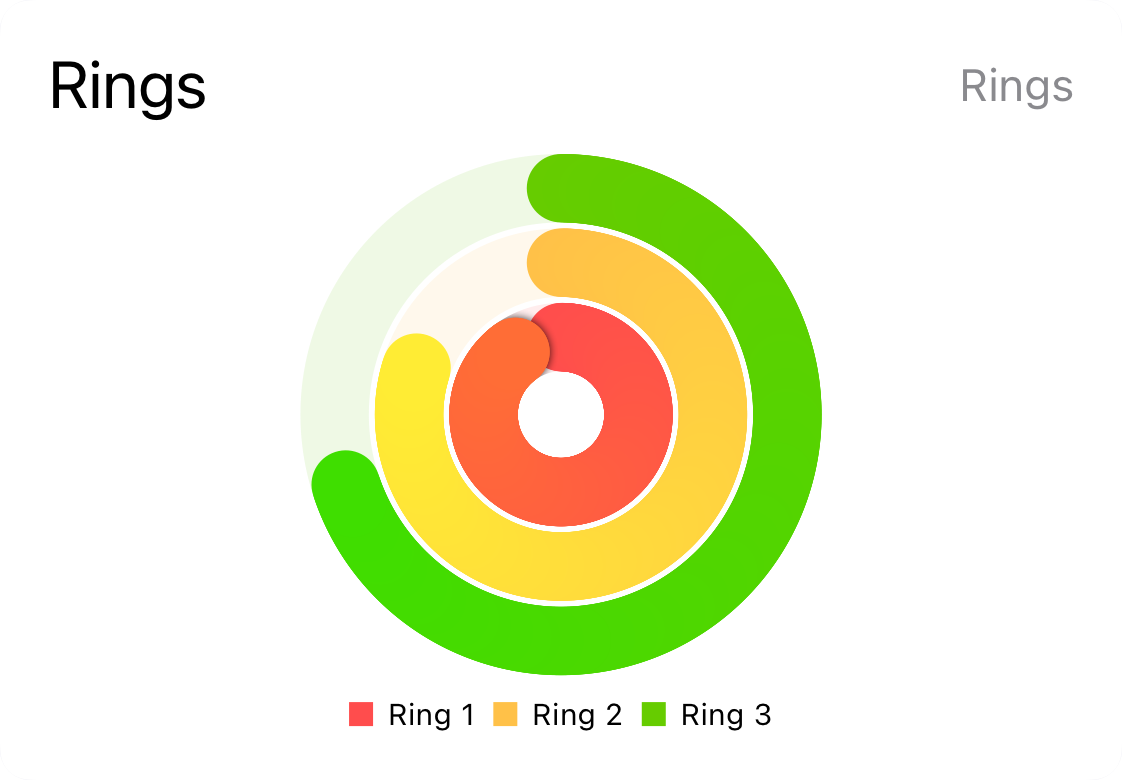
Creates a ring charts with 3 different series to show you how easy it is to create ring charts in Charty.
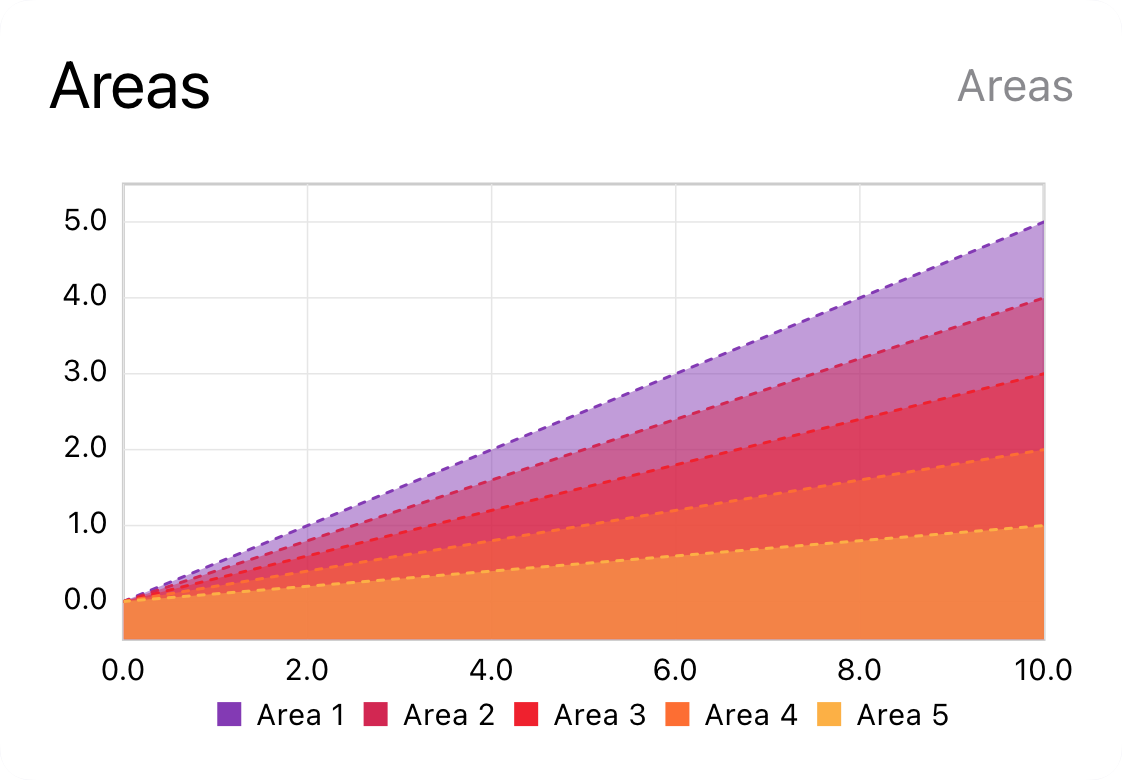
Uses the Style Line Series action to modify line series filling the space below them.
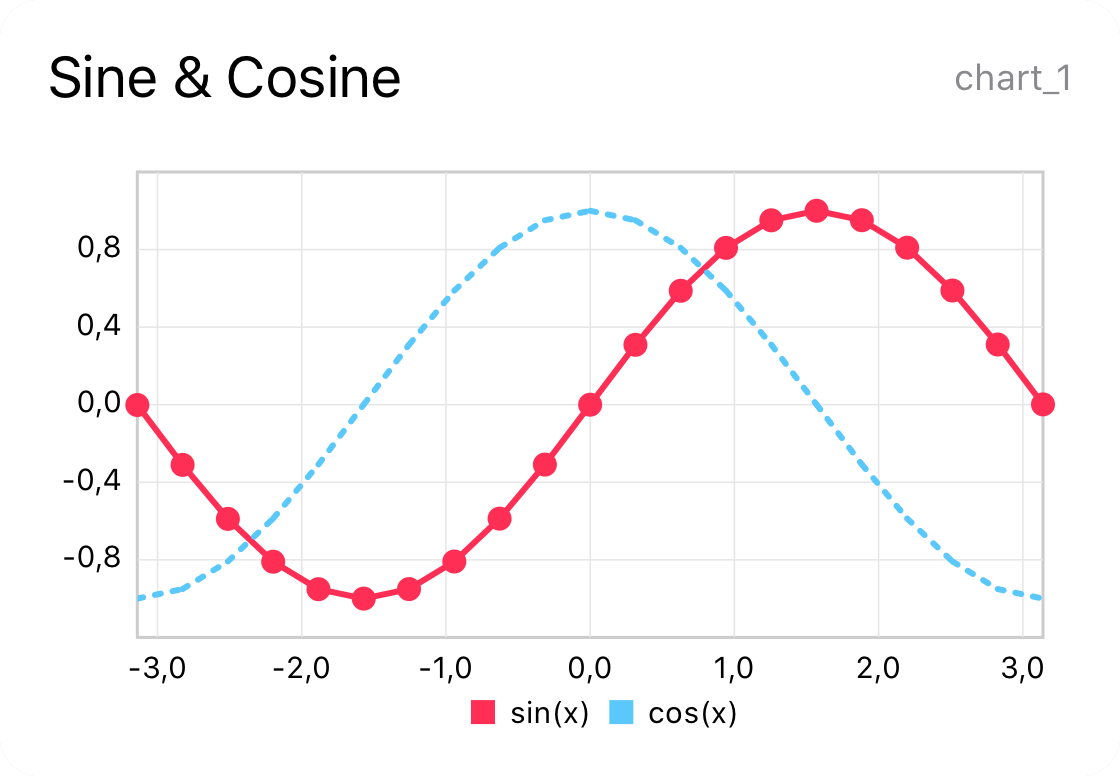
Uses one repeat and some calculations actions to compute the values of sine and cosine between -π and π.
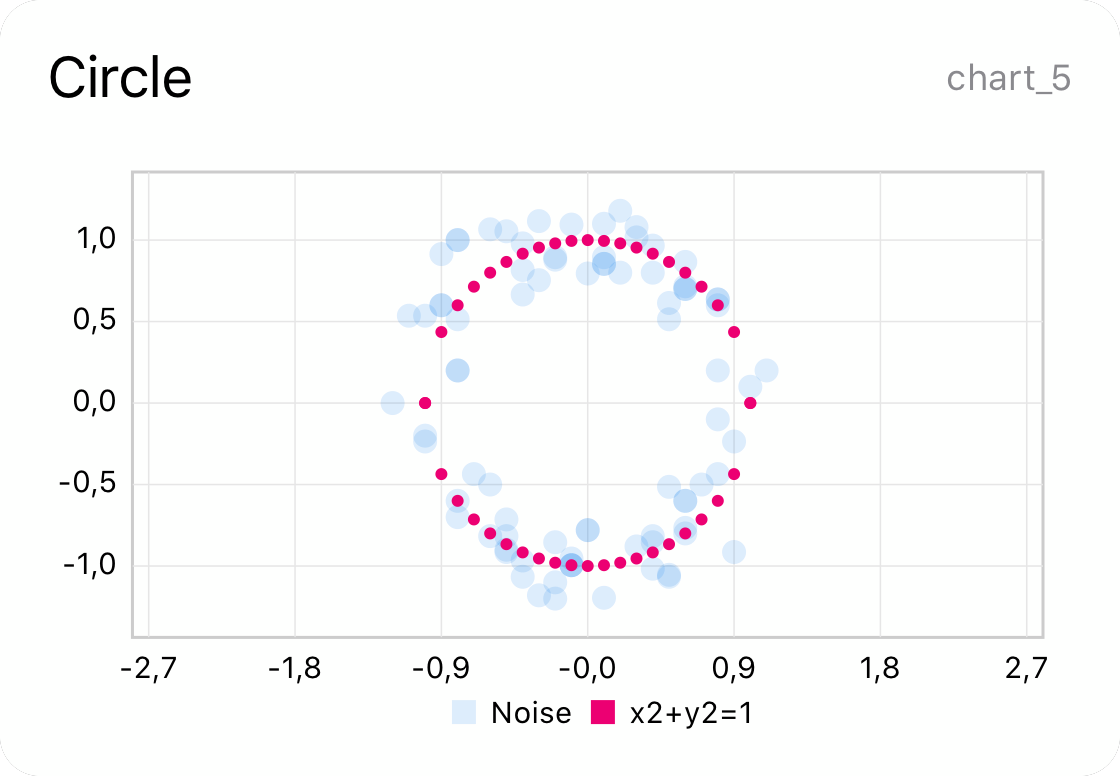
Uses one repeat actions and lots of calculations to calculate the points that create a circle with radius 1 using the x² + y² = 1 equation. It also calculates 84 other random points around the circle to add some noise behind it.
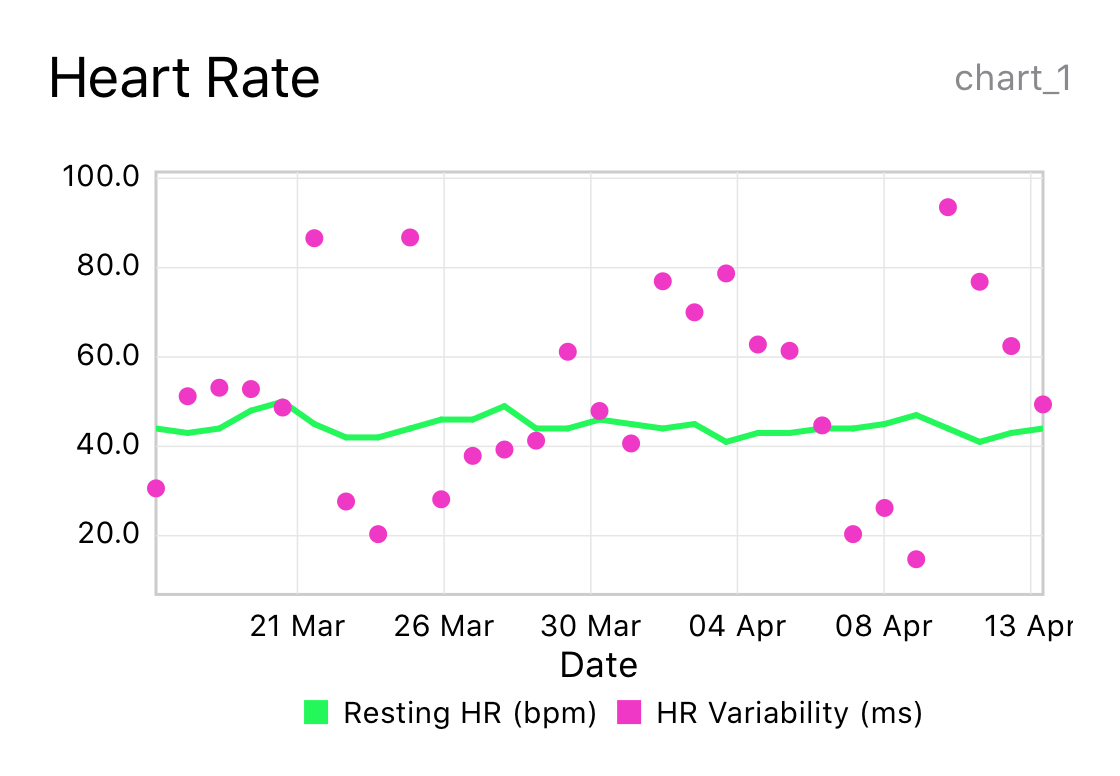
Uses two Find Health Sample actions, to get daily Resting Heart Rate and Heart Rate Variability measurements from the last 30 days.
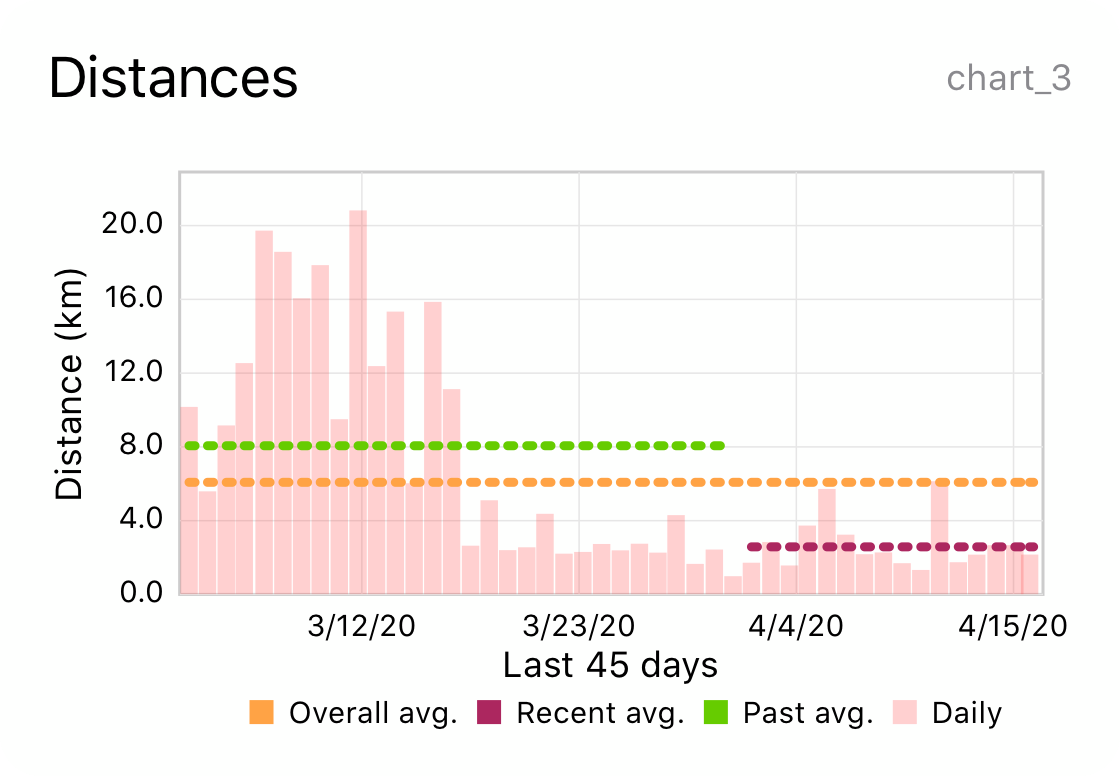
Uses Find Health Sample action to extract daily walked+ran distances for the last 45 days, the calculates average values for the first 30 days, the last 15 and all values.
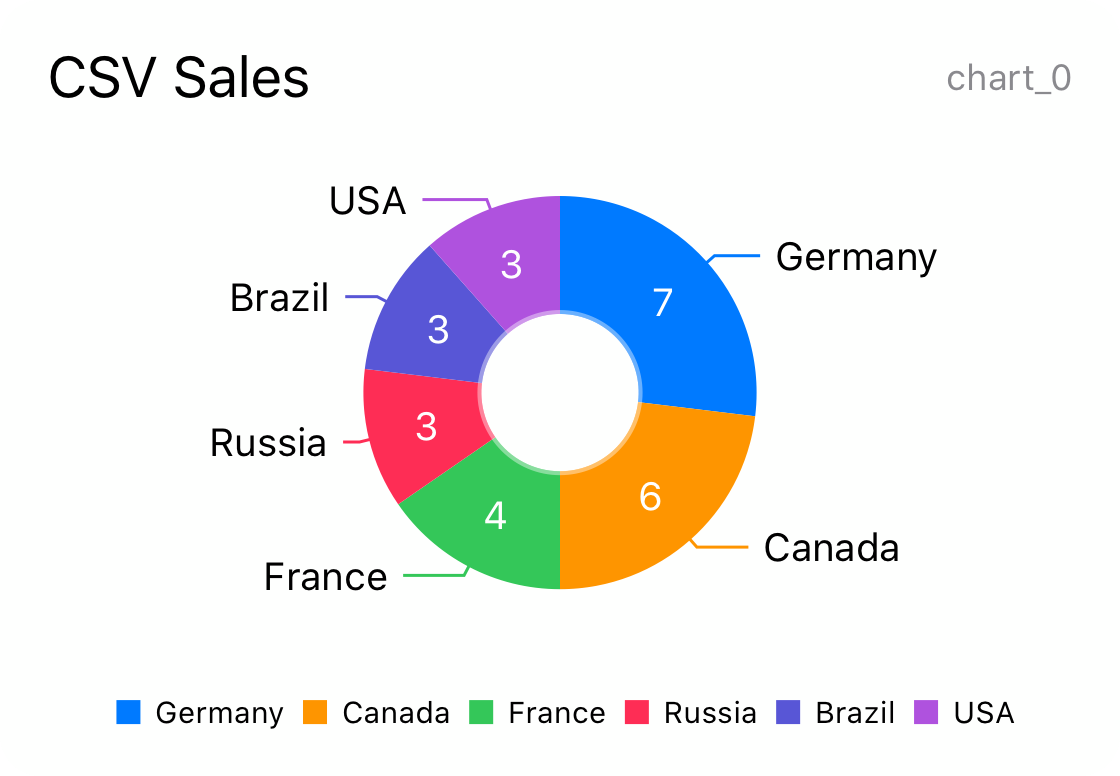
Uses the Add Series From CSV action to create a donut chart from a csv file.
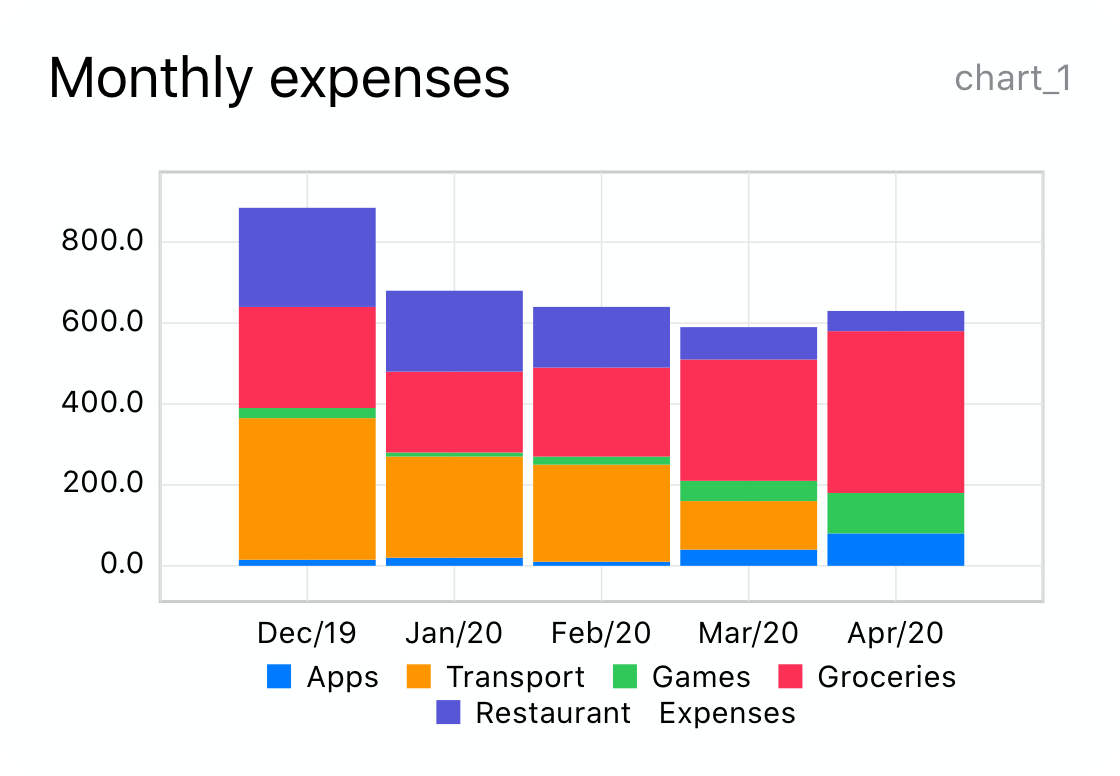
Processes expenses stored on a text action to create monthly stacked bars representing expenditure on 5 categories.